Investor FAQs
For more information, please contact us.
About Intertek
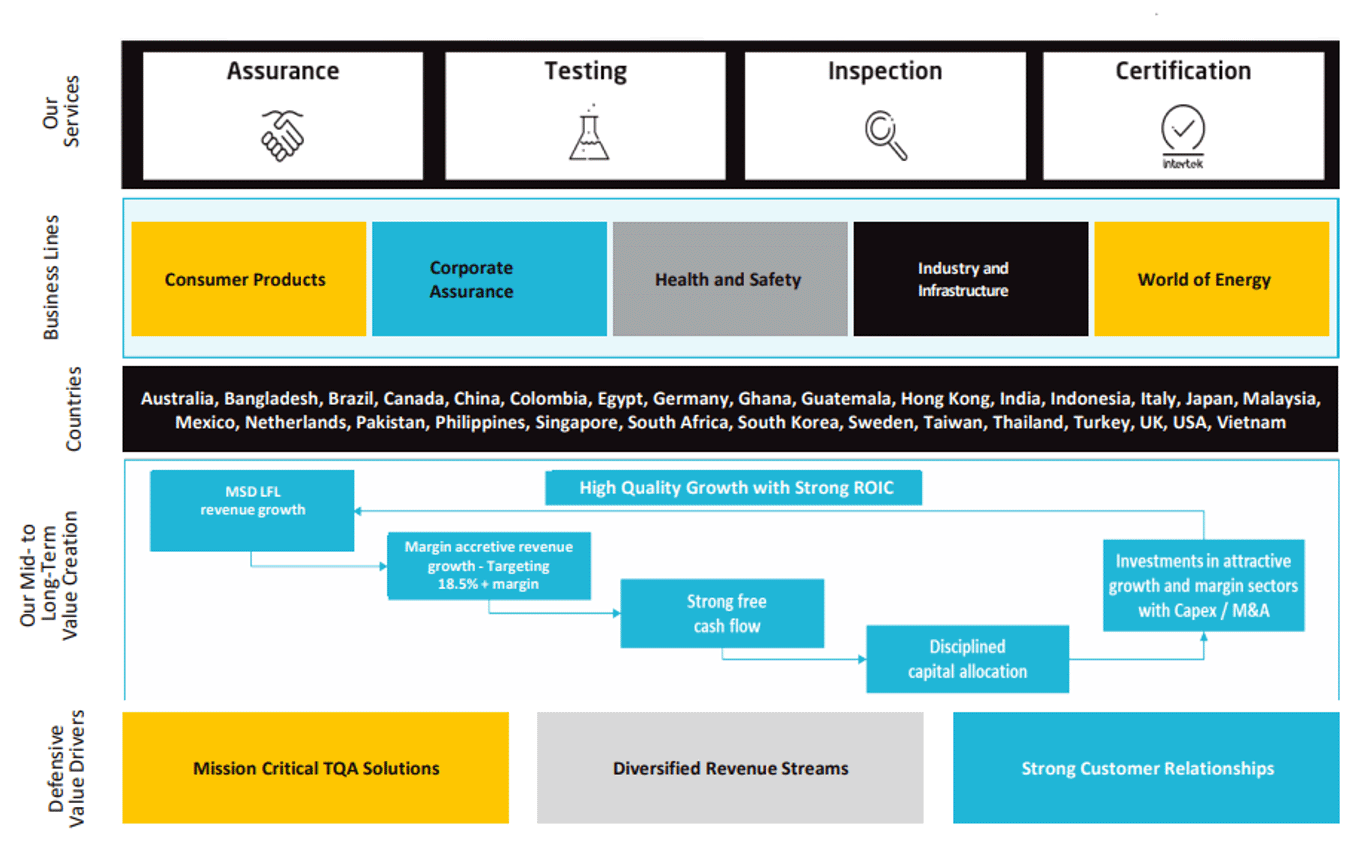
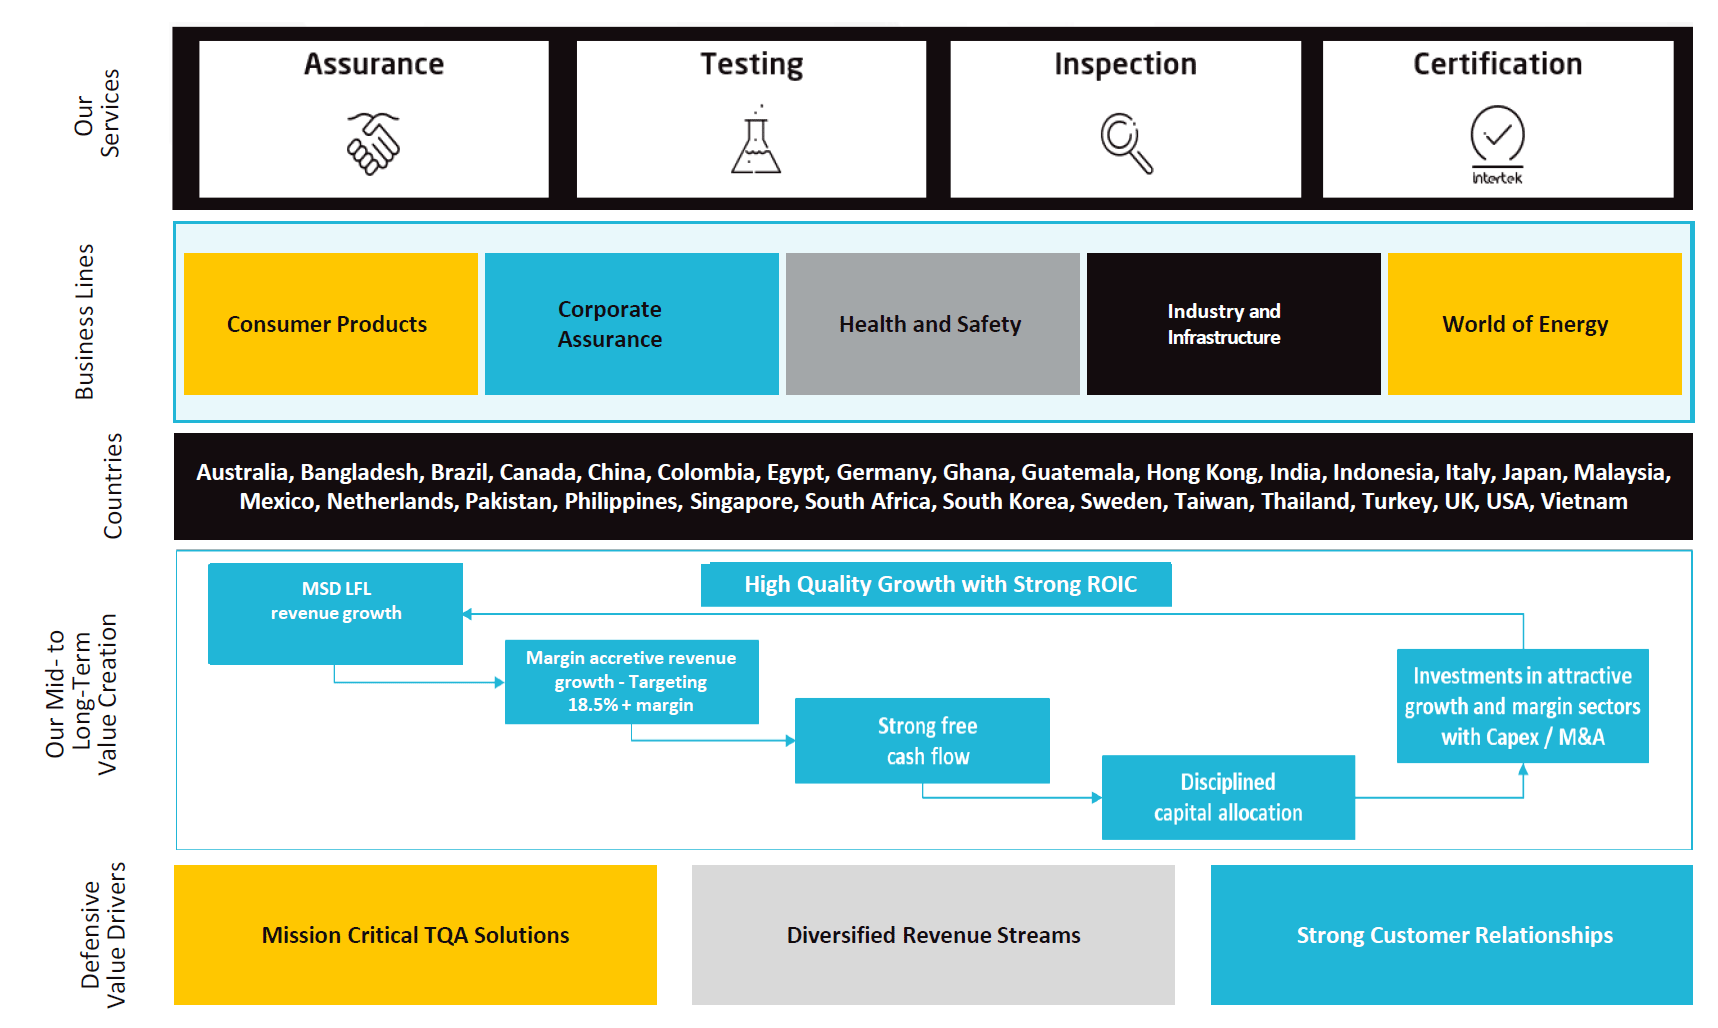
We operate in more than 100 countries in a variety of markets and industries, ranging from consumer goods to the energy sector, and we deliver a wide range of ATIC services.
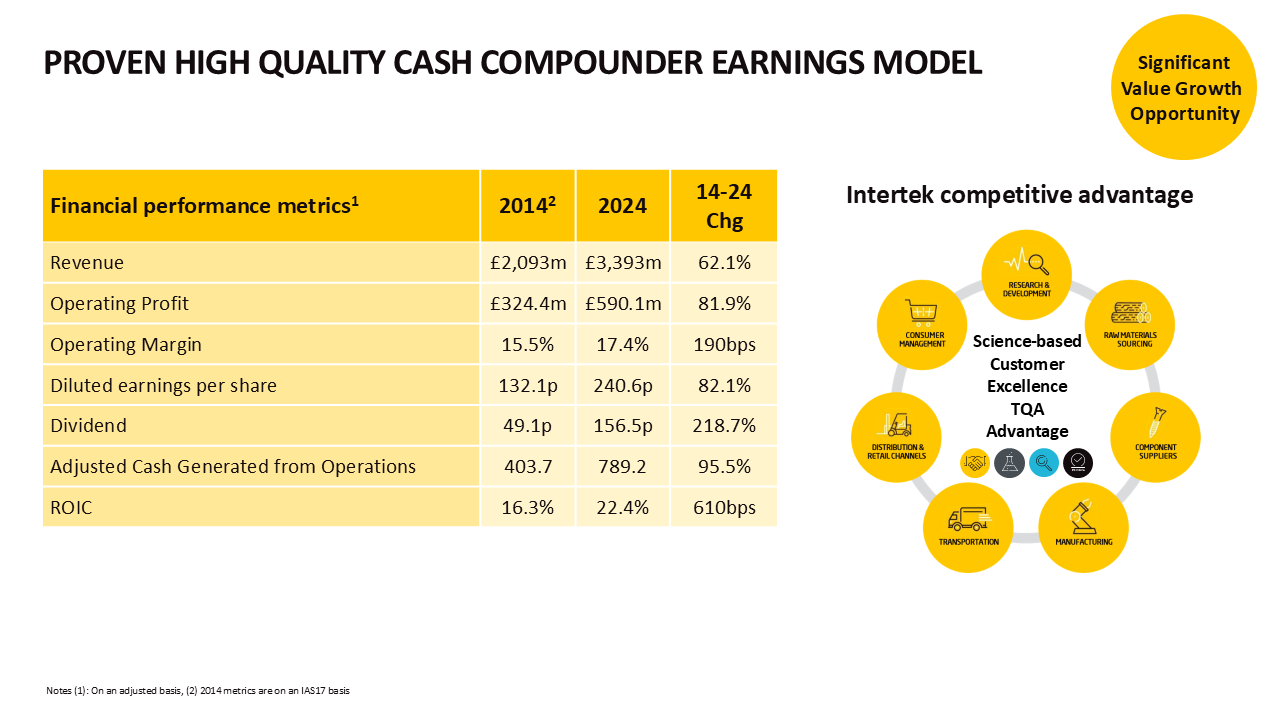
Our Science‐based Customer Excellence is at the core of our competitive advantage and enables us to deliver mission critical services for our clients
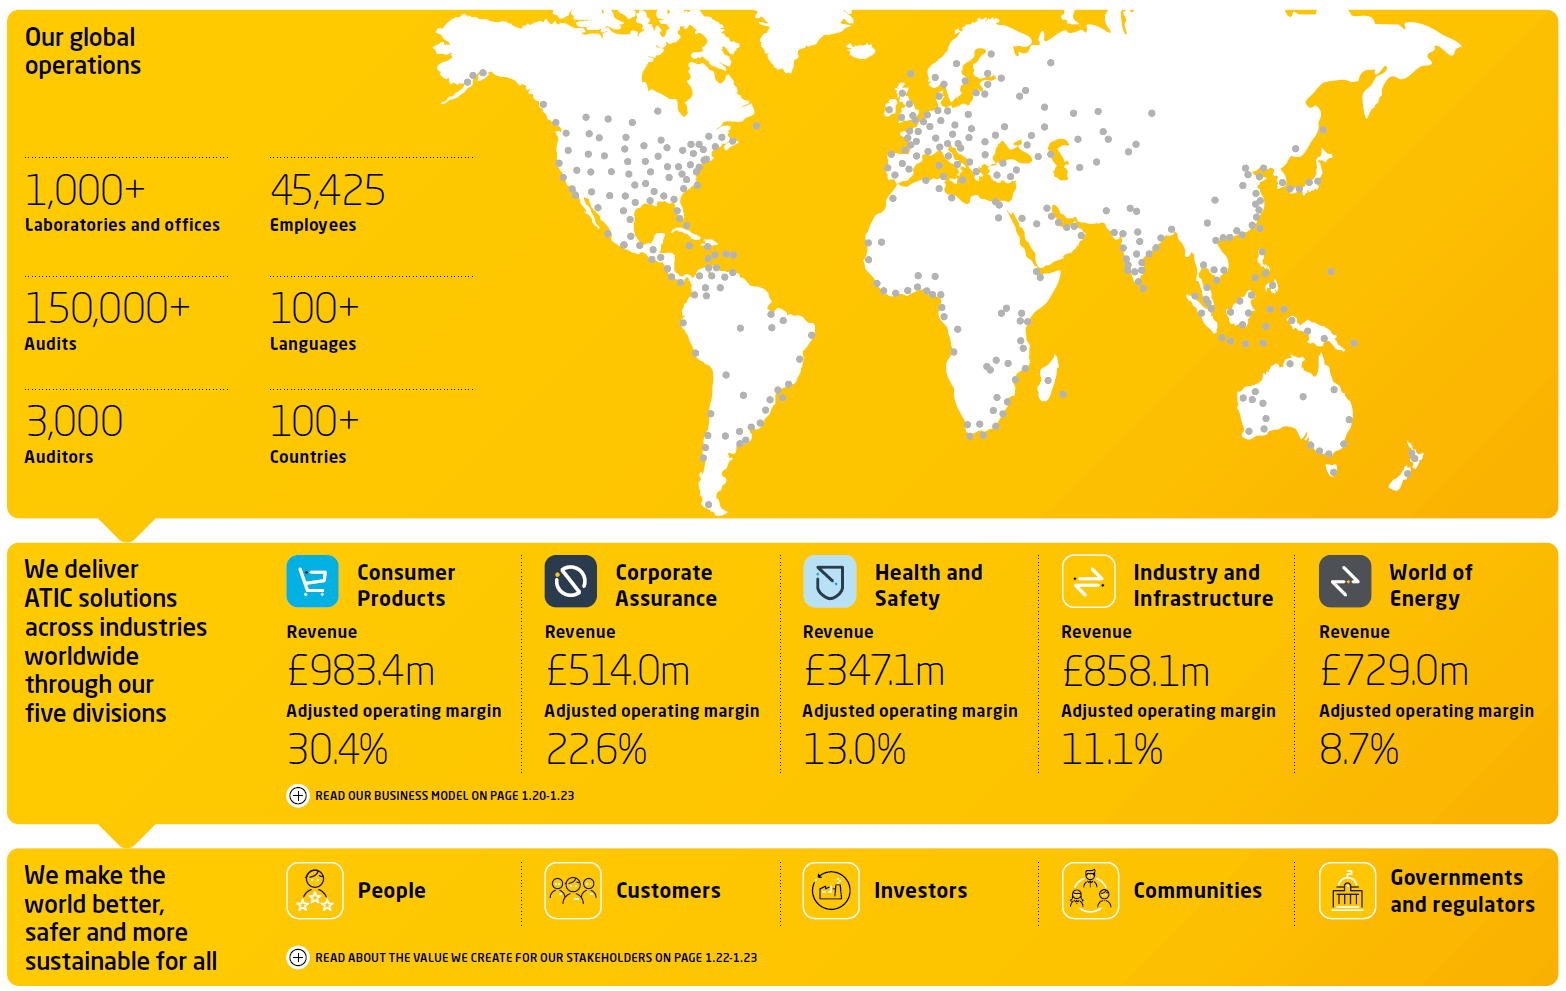
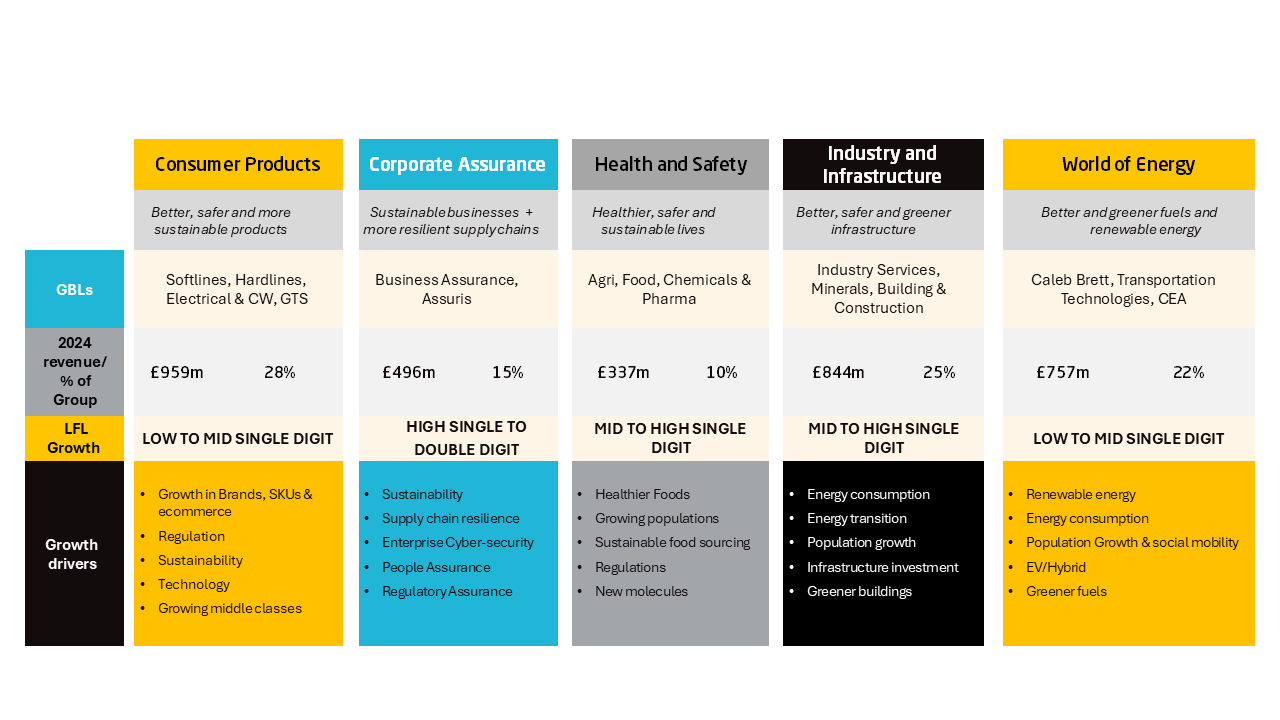
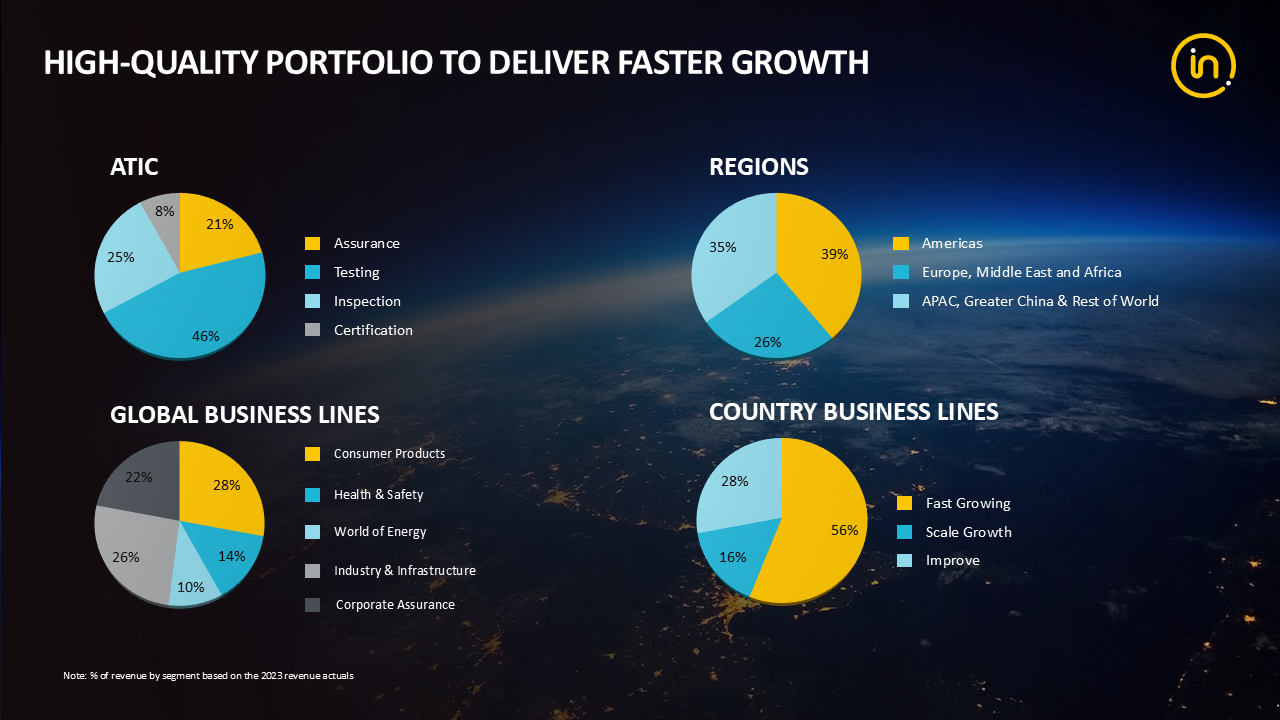
Consumer products (29%) is our largest division, followed by Industry & Infrastructure (25%) and World of Energy (21%). Corporate Assurance (15%) and Health & Safety (10%) and account for the remaining 25%.
FY25 revenues by division

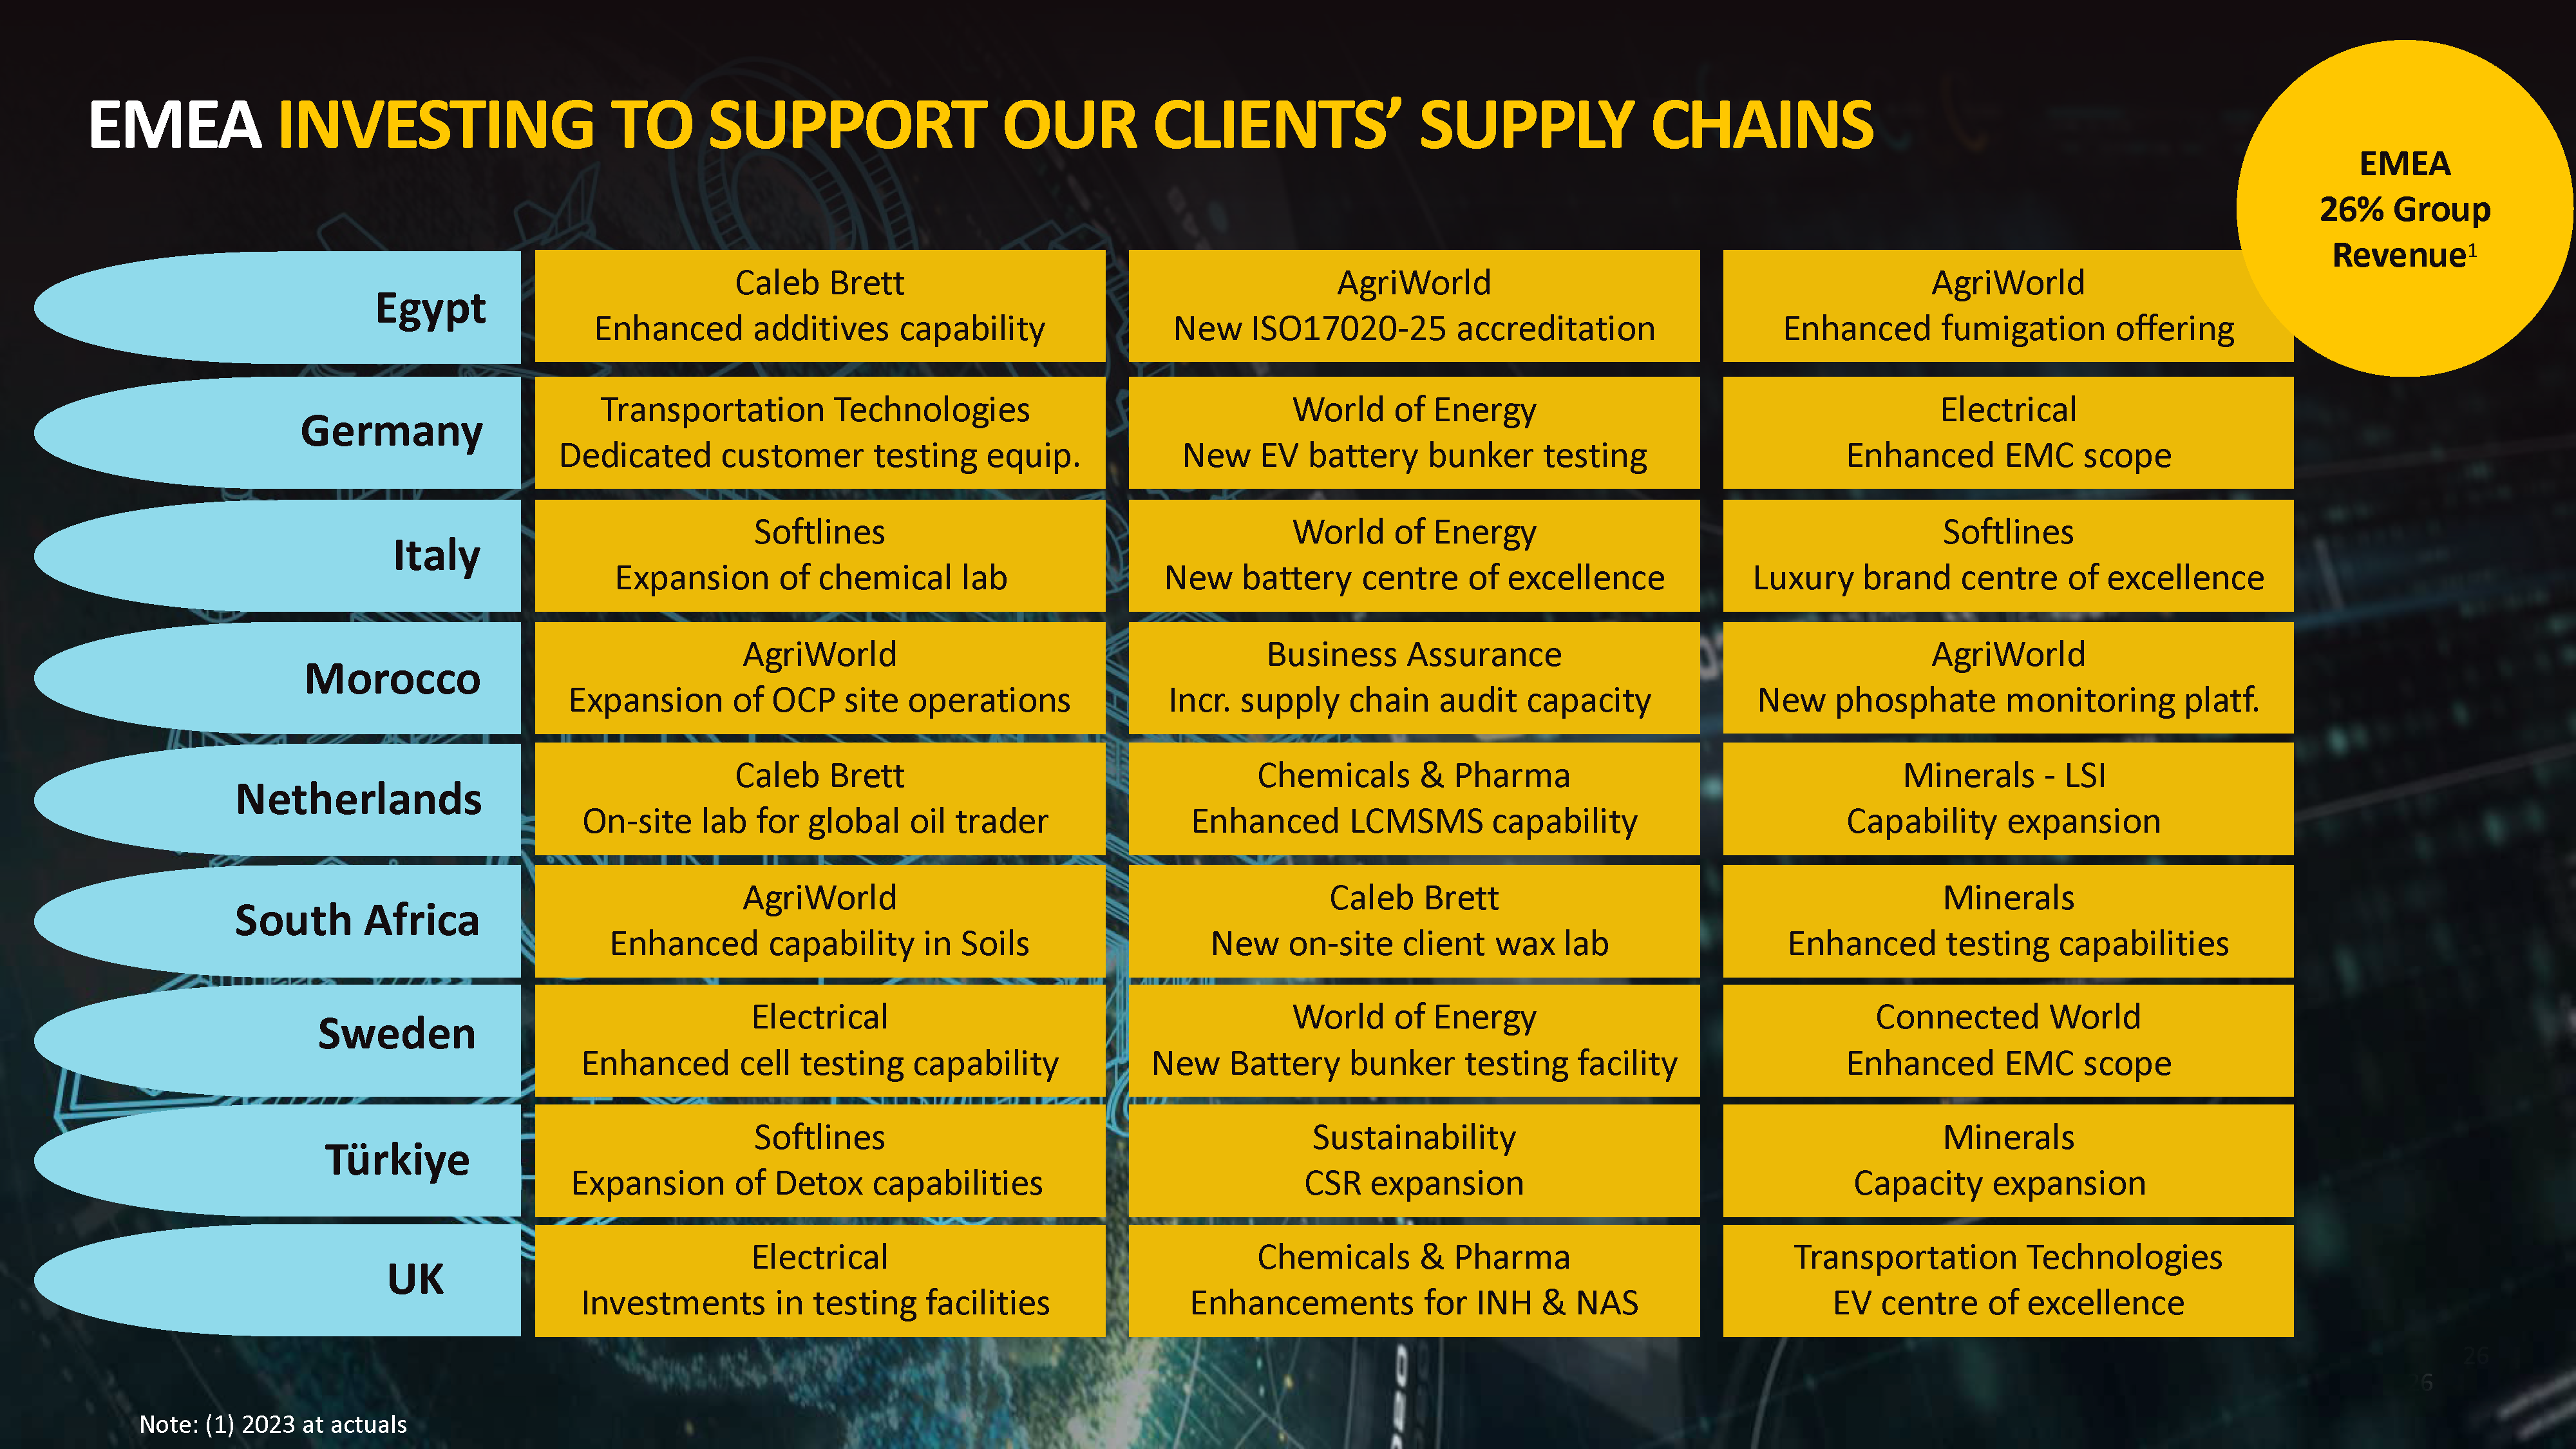
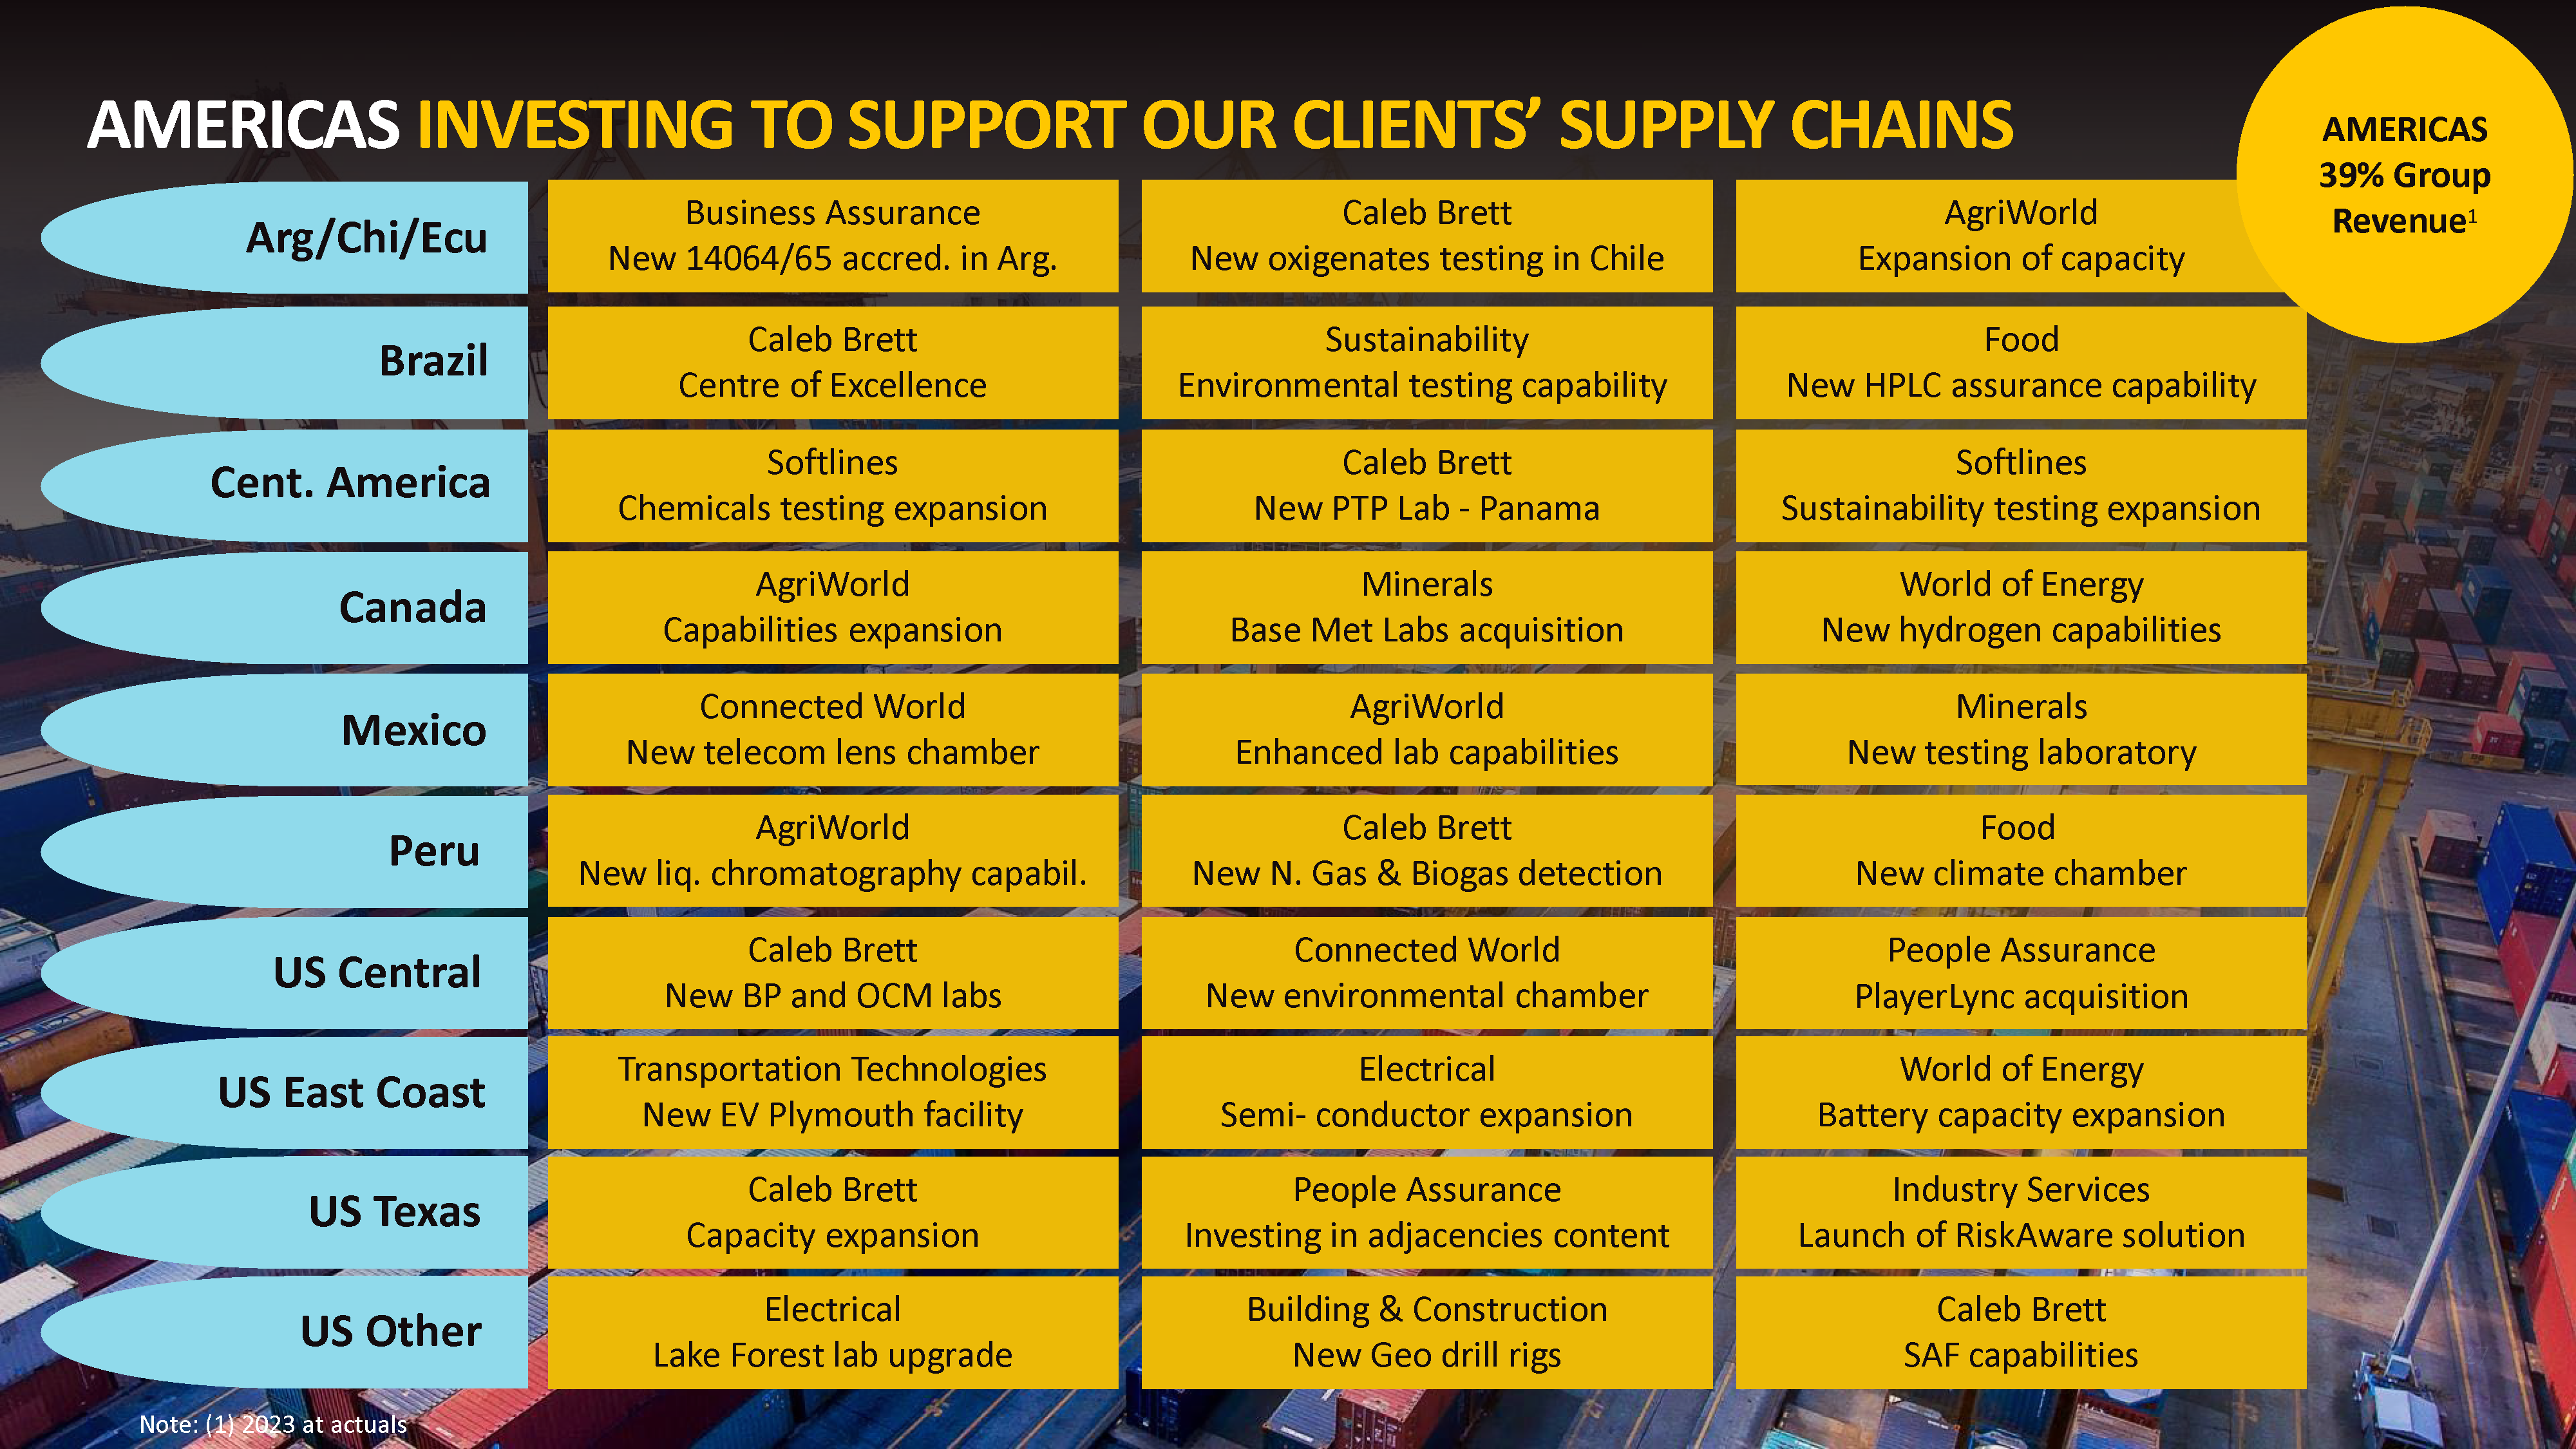
As a global company, we have operations in the Americas (37.3%), APAC (35.3%) and EMEA (27.3%).
FY25 revenue by region

With over 45,000 employees spanning over 100 countries, Intertek is a truly global company. We cover all aspects of the value chain through our 5 divisions with over 1,000 labs and offices.
To access the pages referenced above, read our Strategic Report.
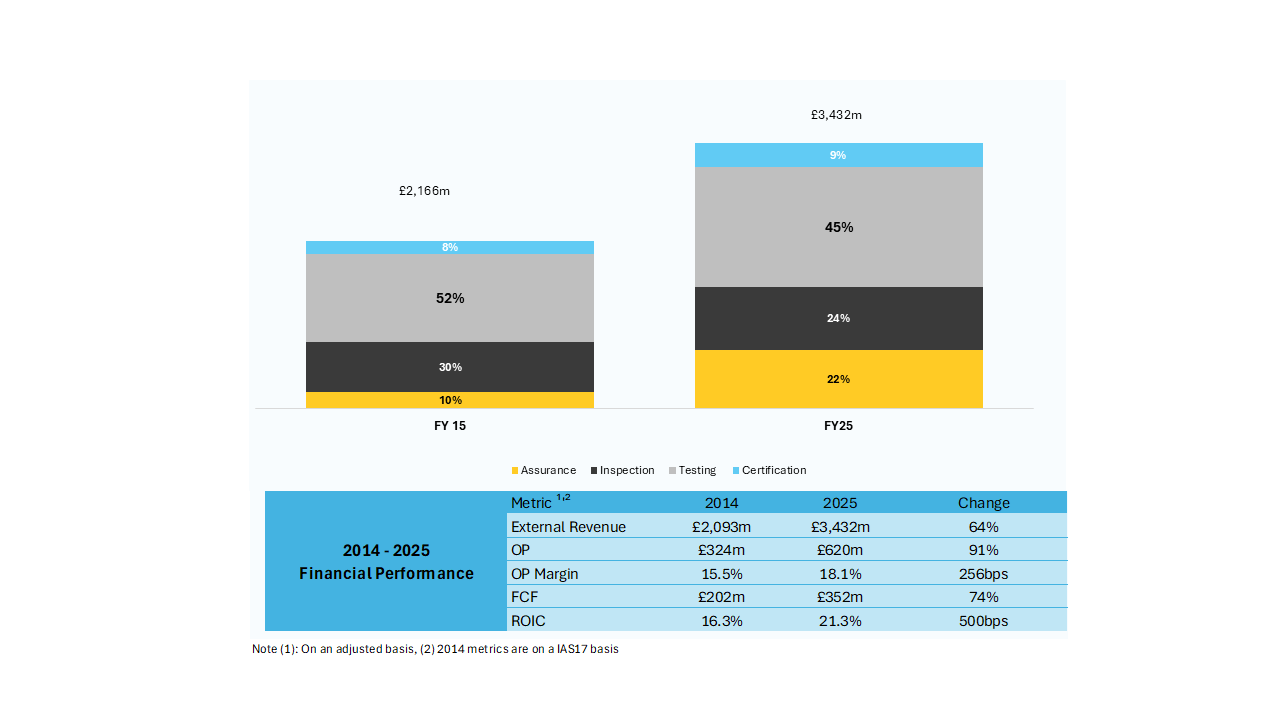
The split of our revenue continues to evolve with Assurance making up a greater percentage. Testing remains our largest service at 45% of revenue.
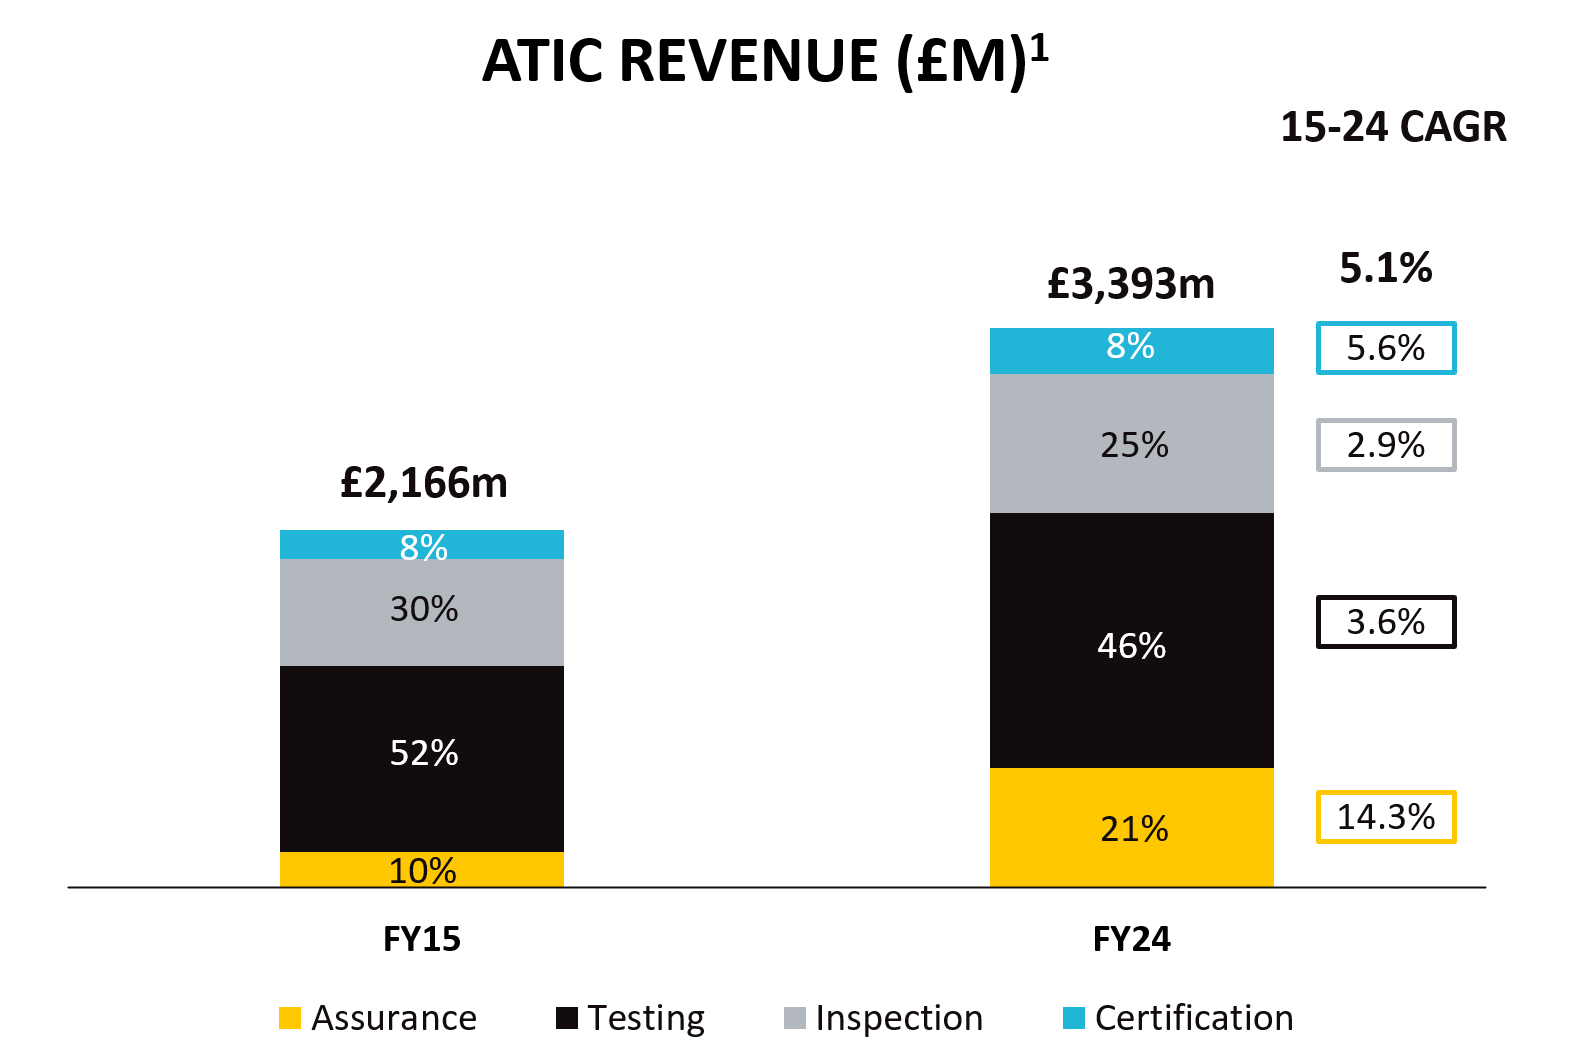
Note: (1) At actual rates
We work with more than 400,000 clients around the world and enjoy long-lasting relationships based on our superior customer service.
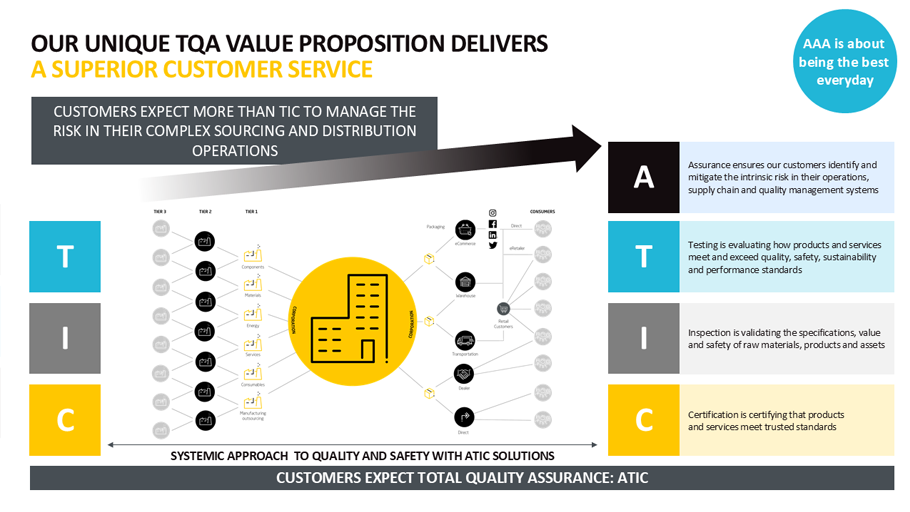
We provide independent quality assurance services that are mission critical for our clients. We have a strong technical expertise in all the sectors we operate in and when combined with our passionate and entrepreneurial culture, this enables us to support the growth agenda of our clients in an ever-changing and more complex operating environment.
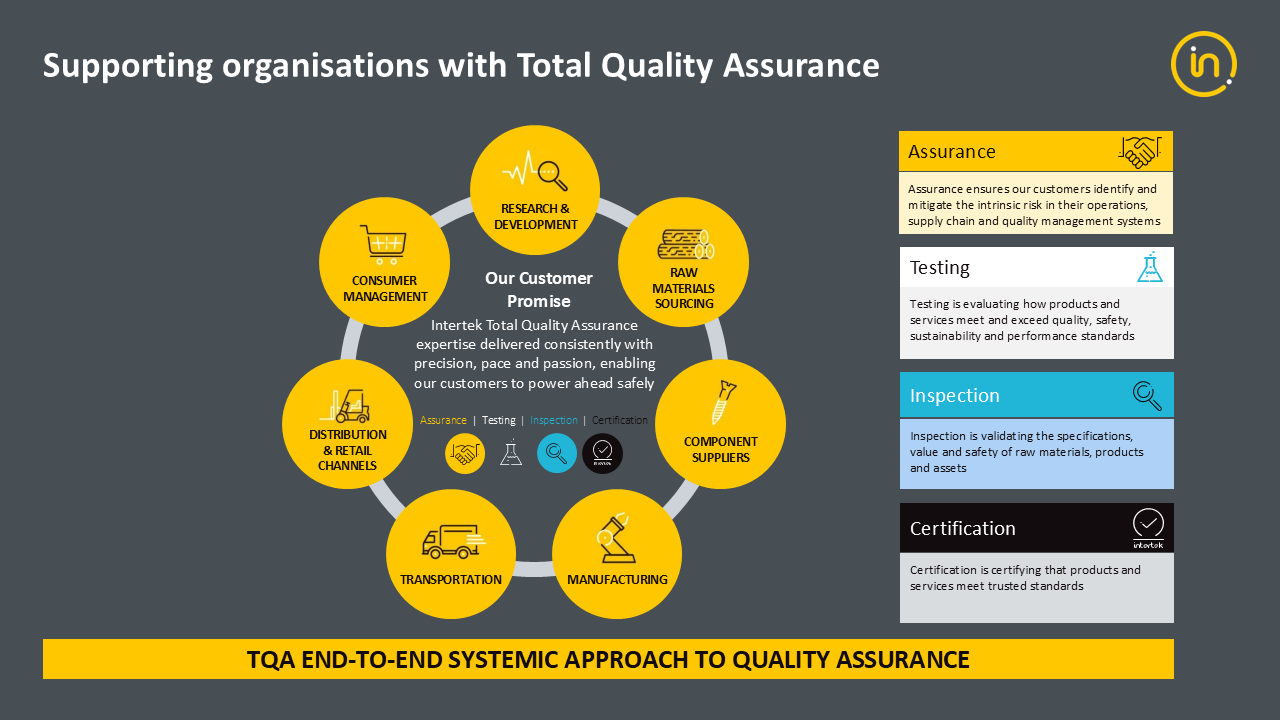
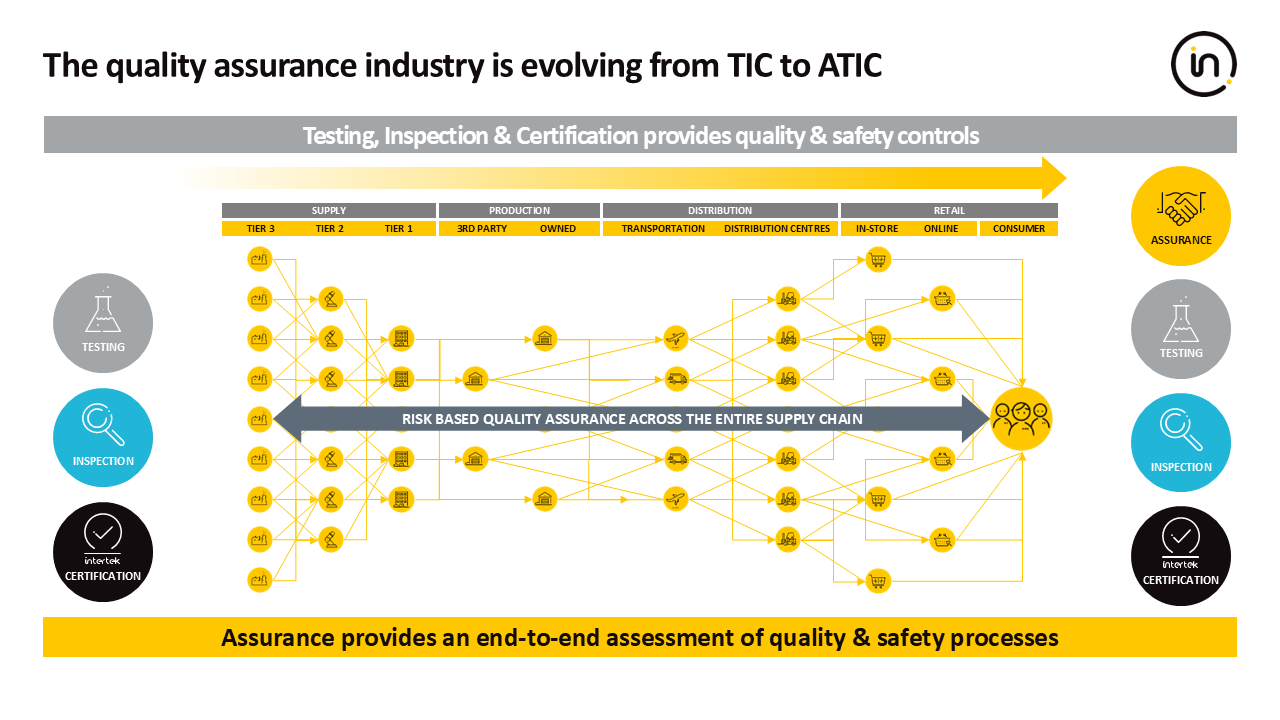
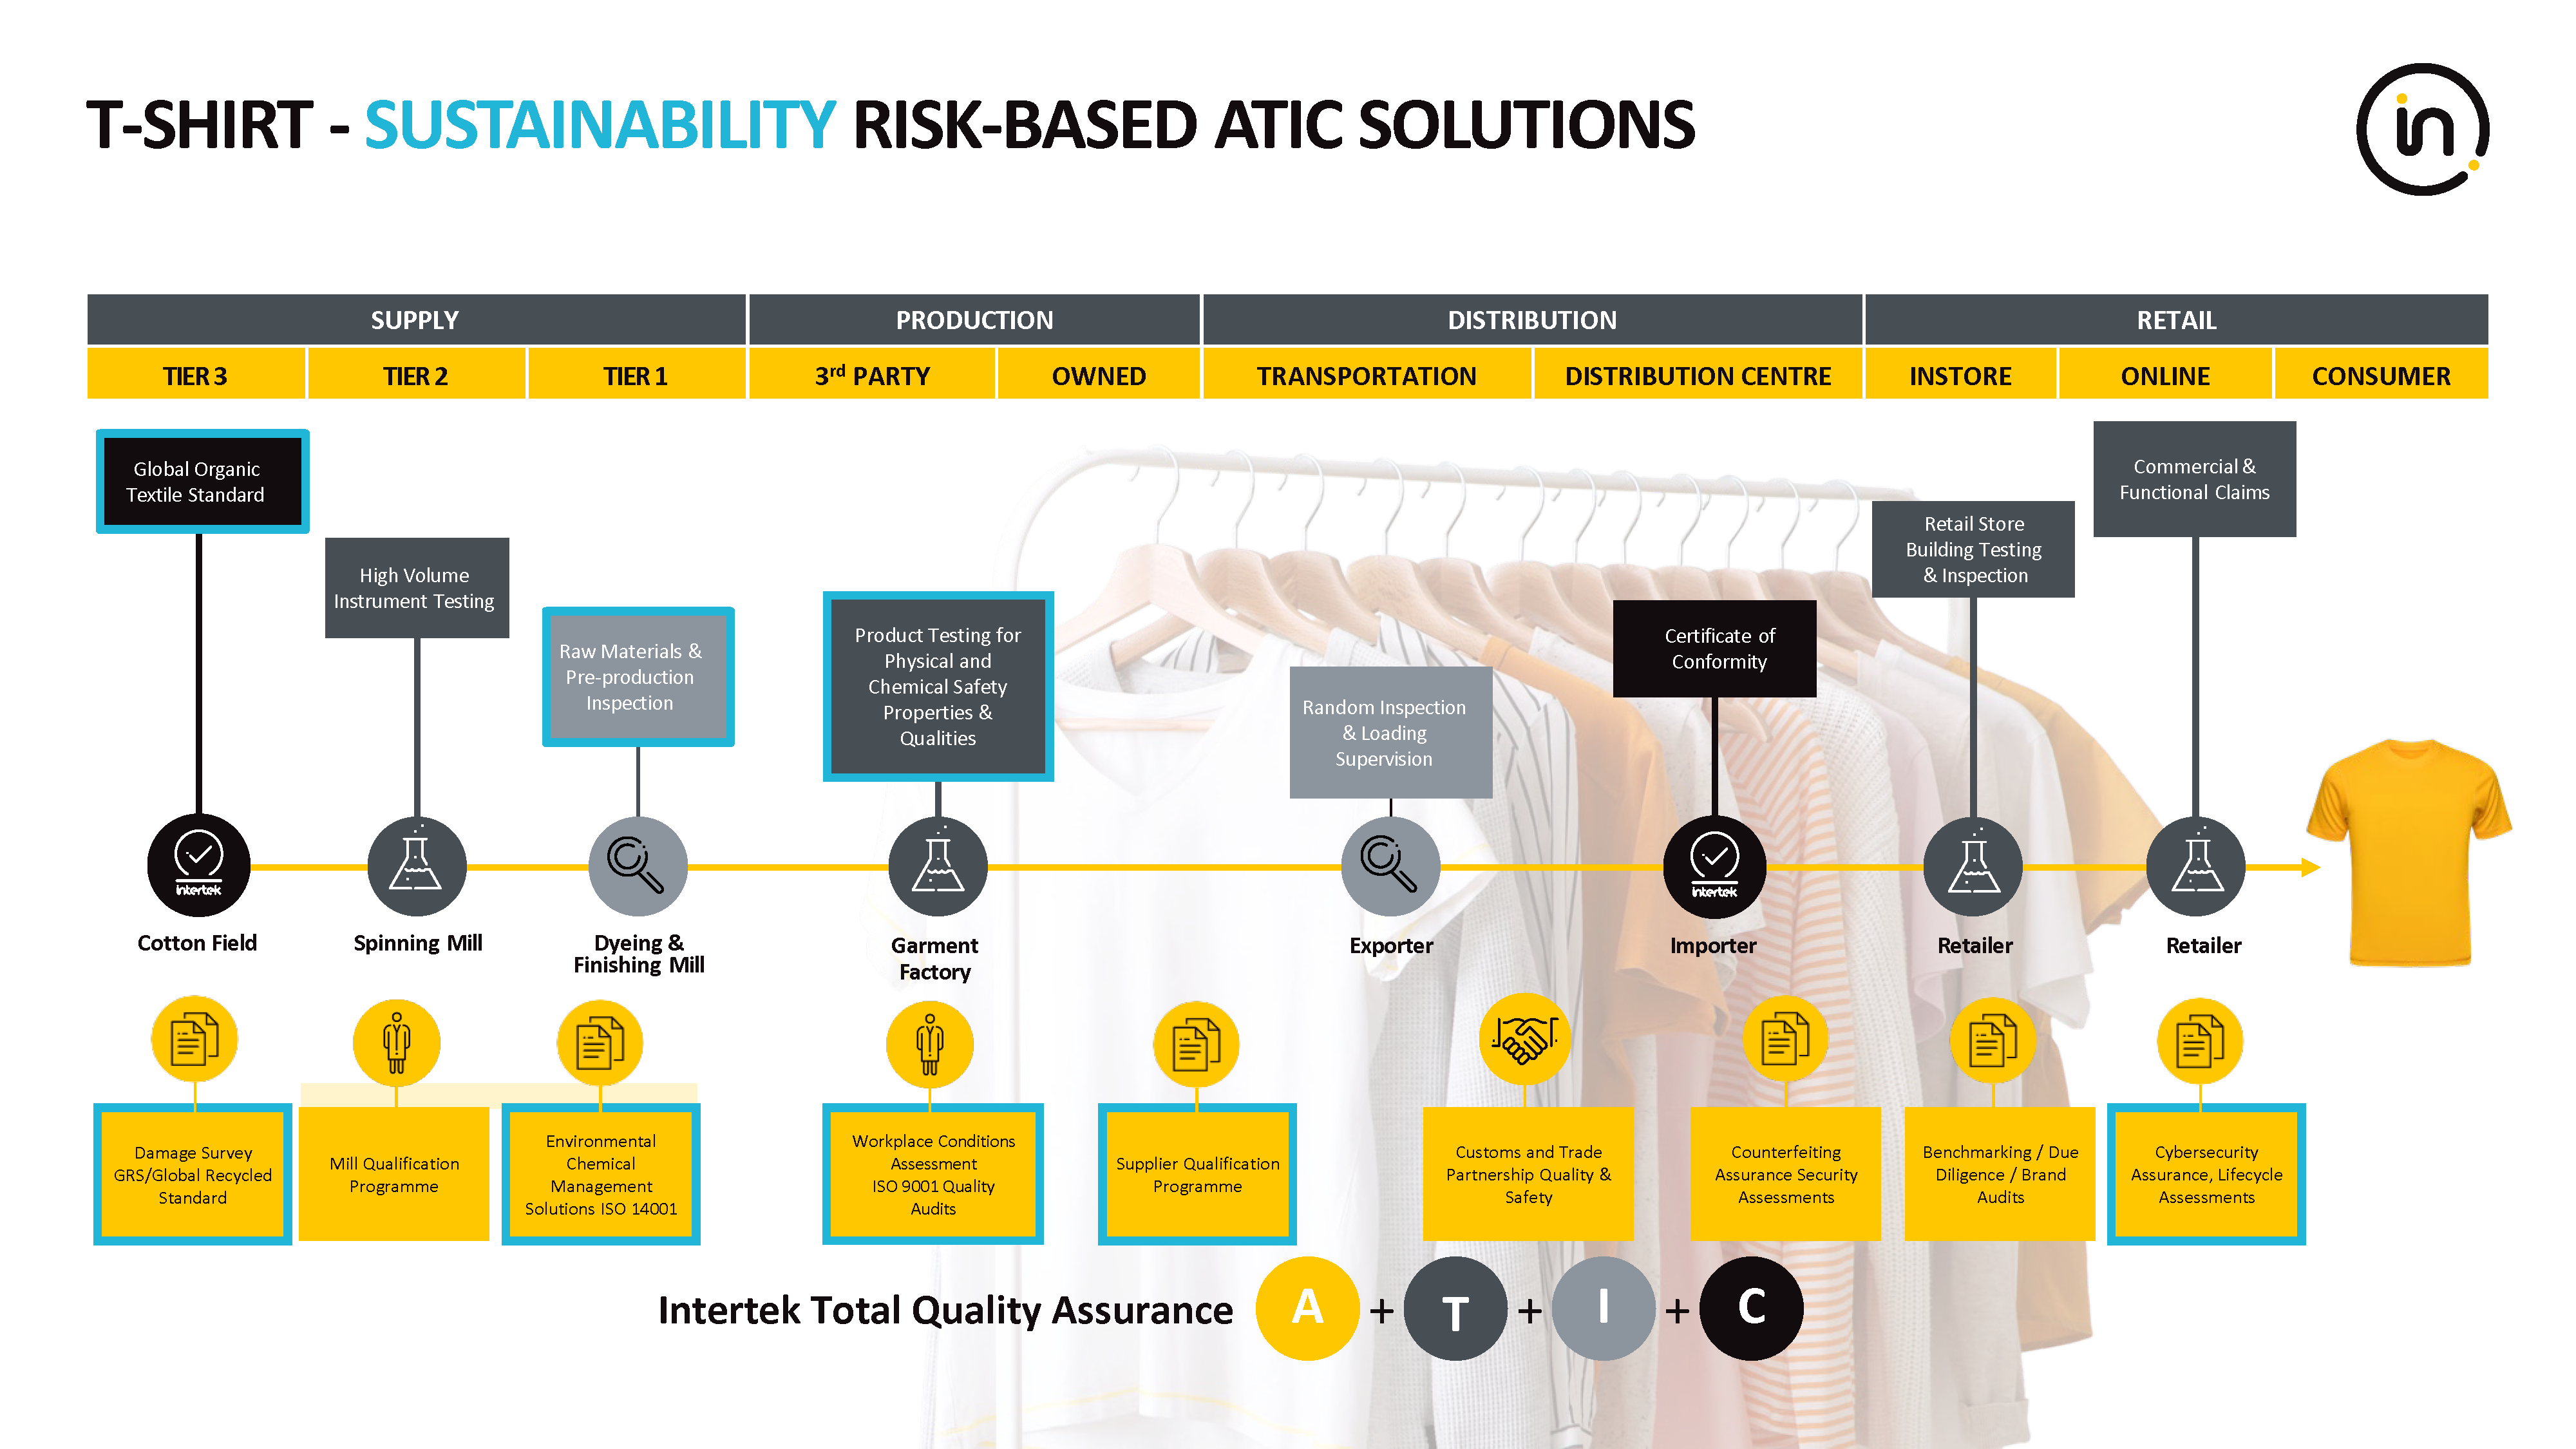
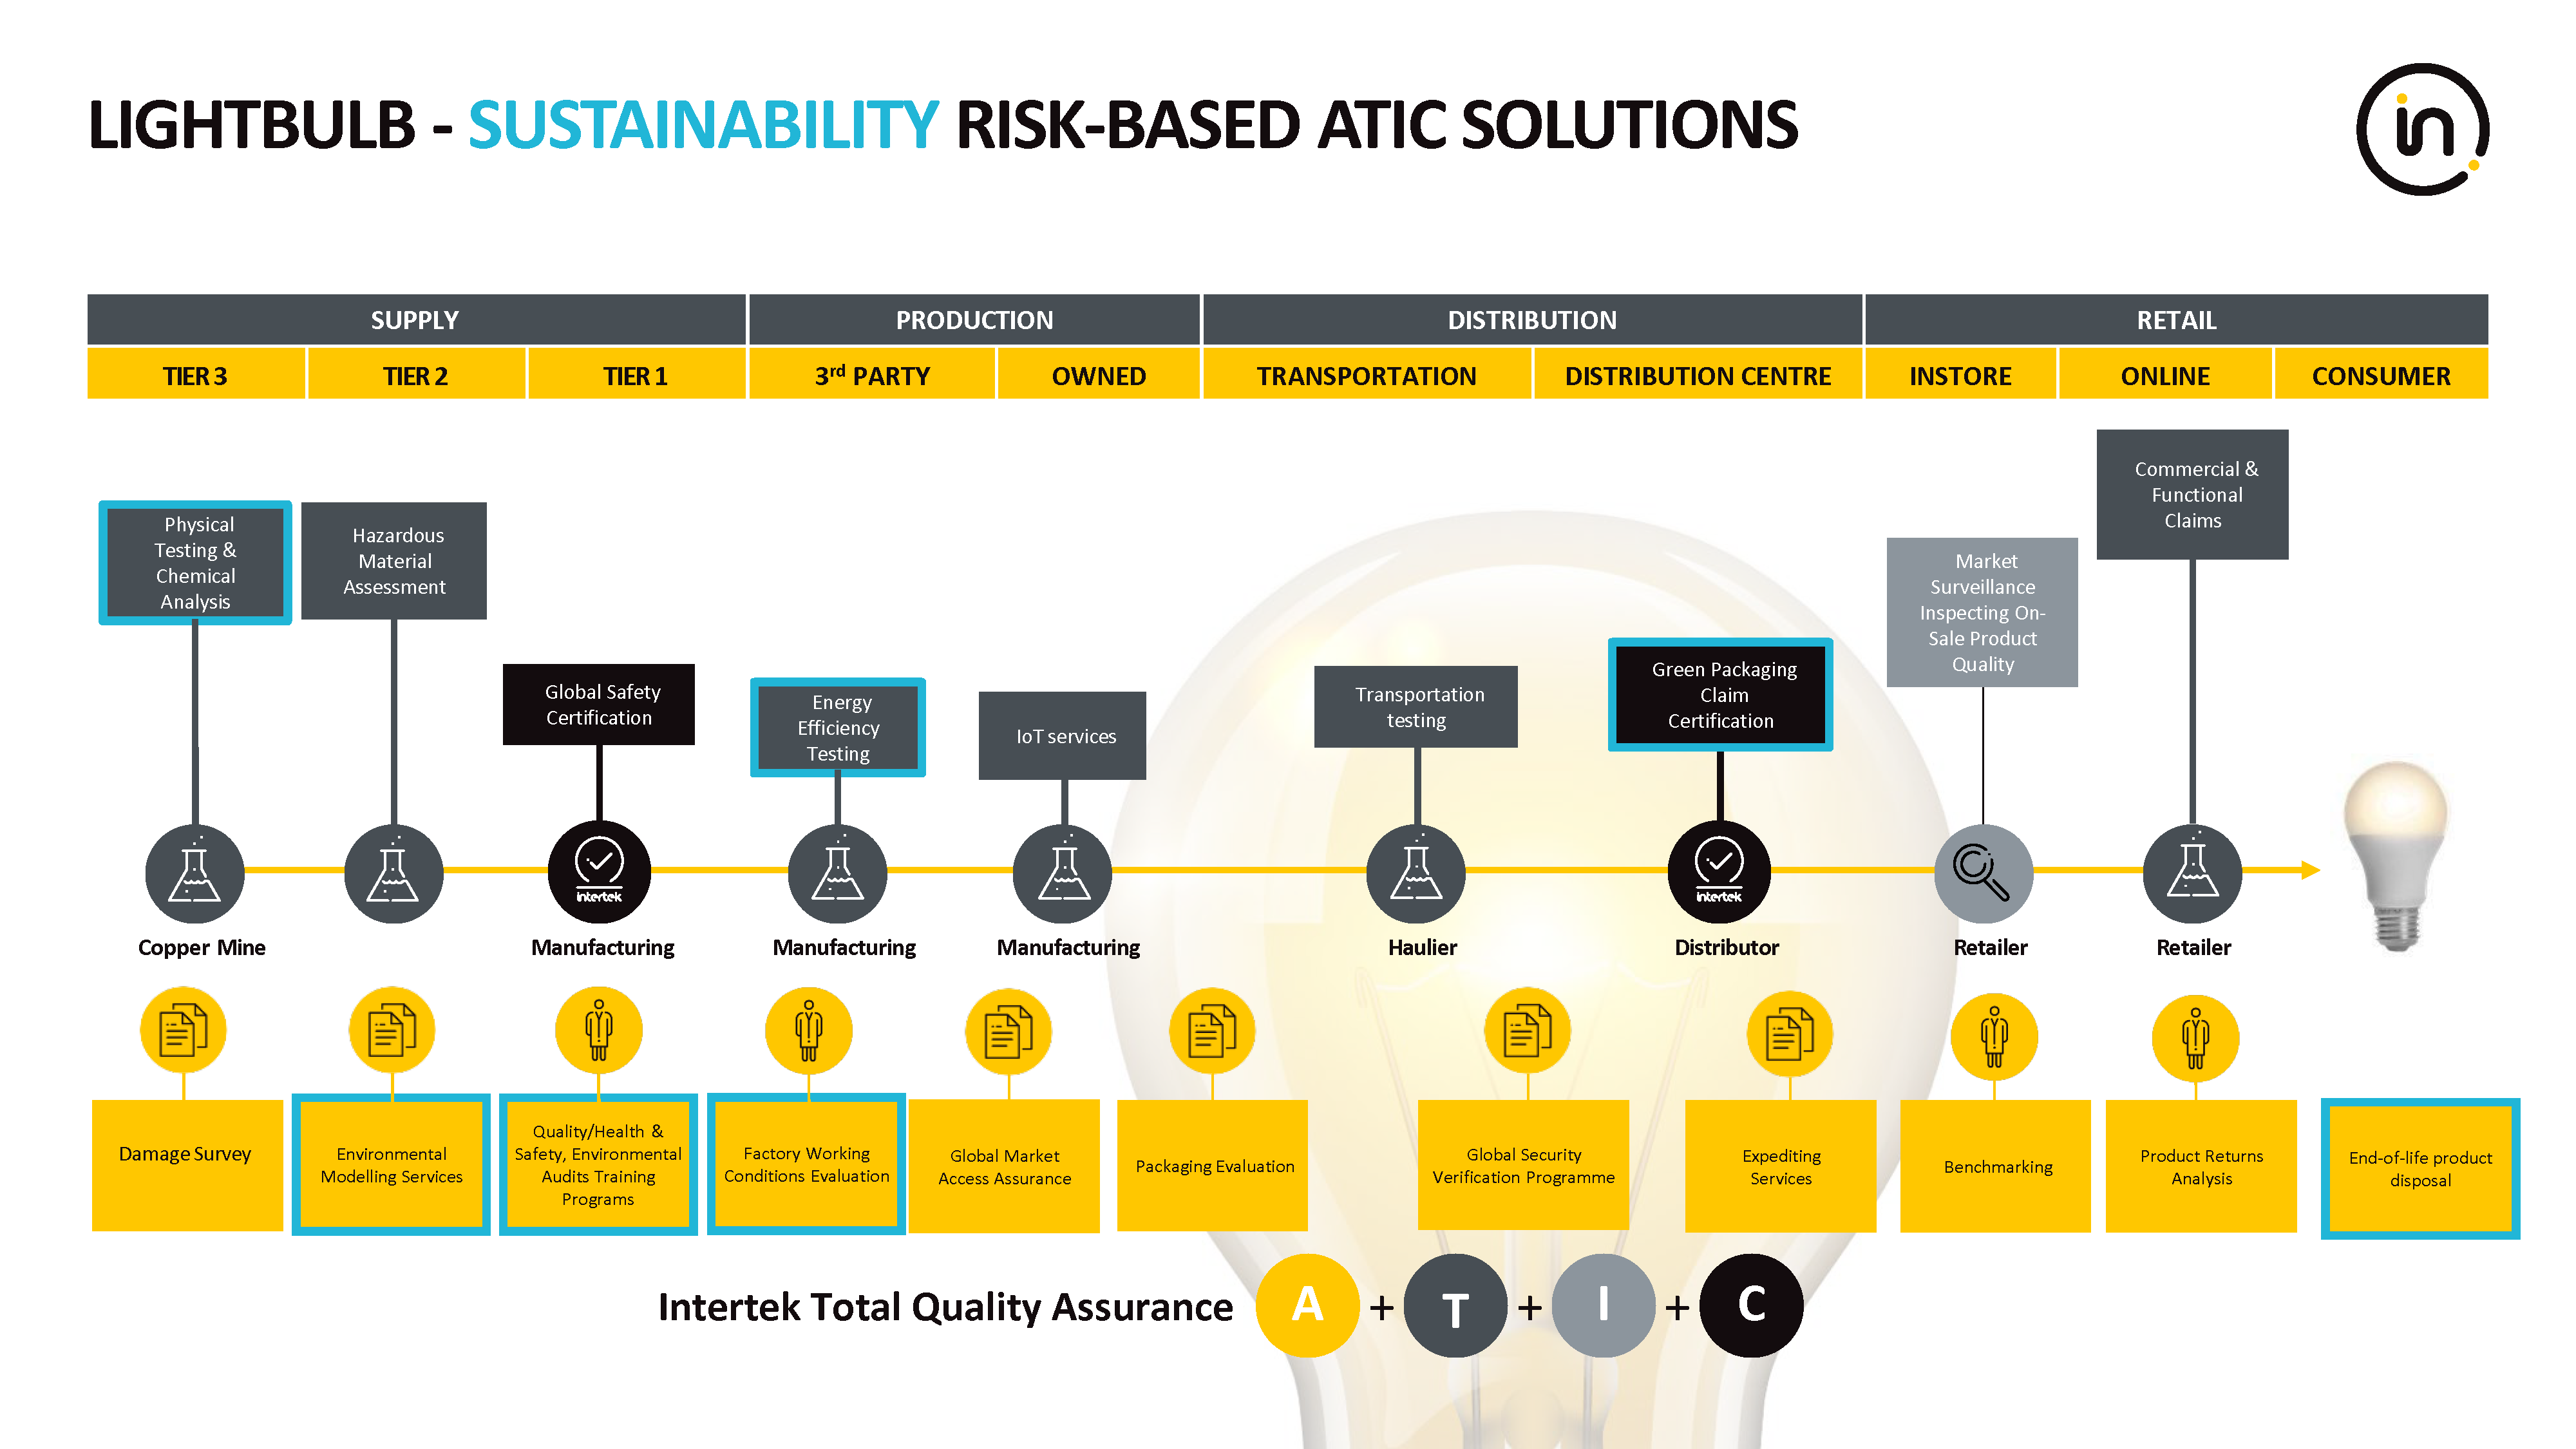
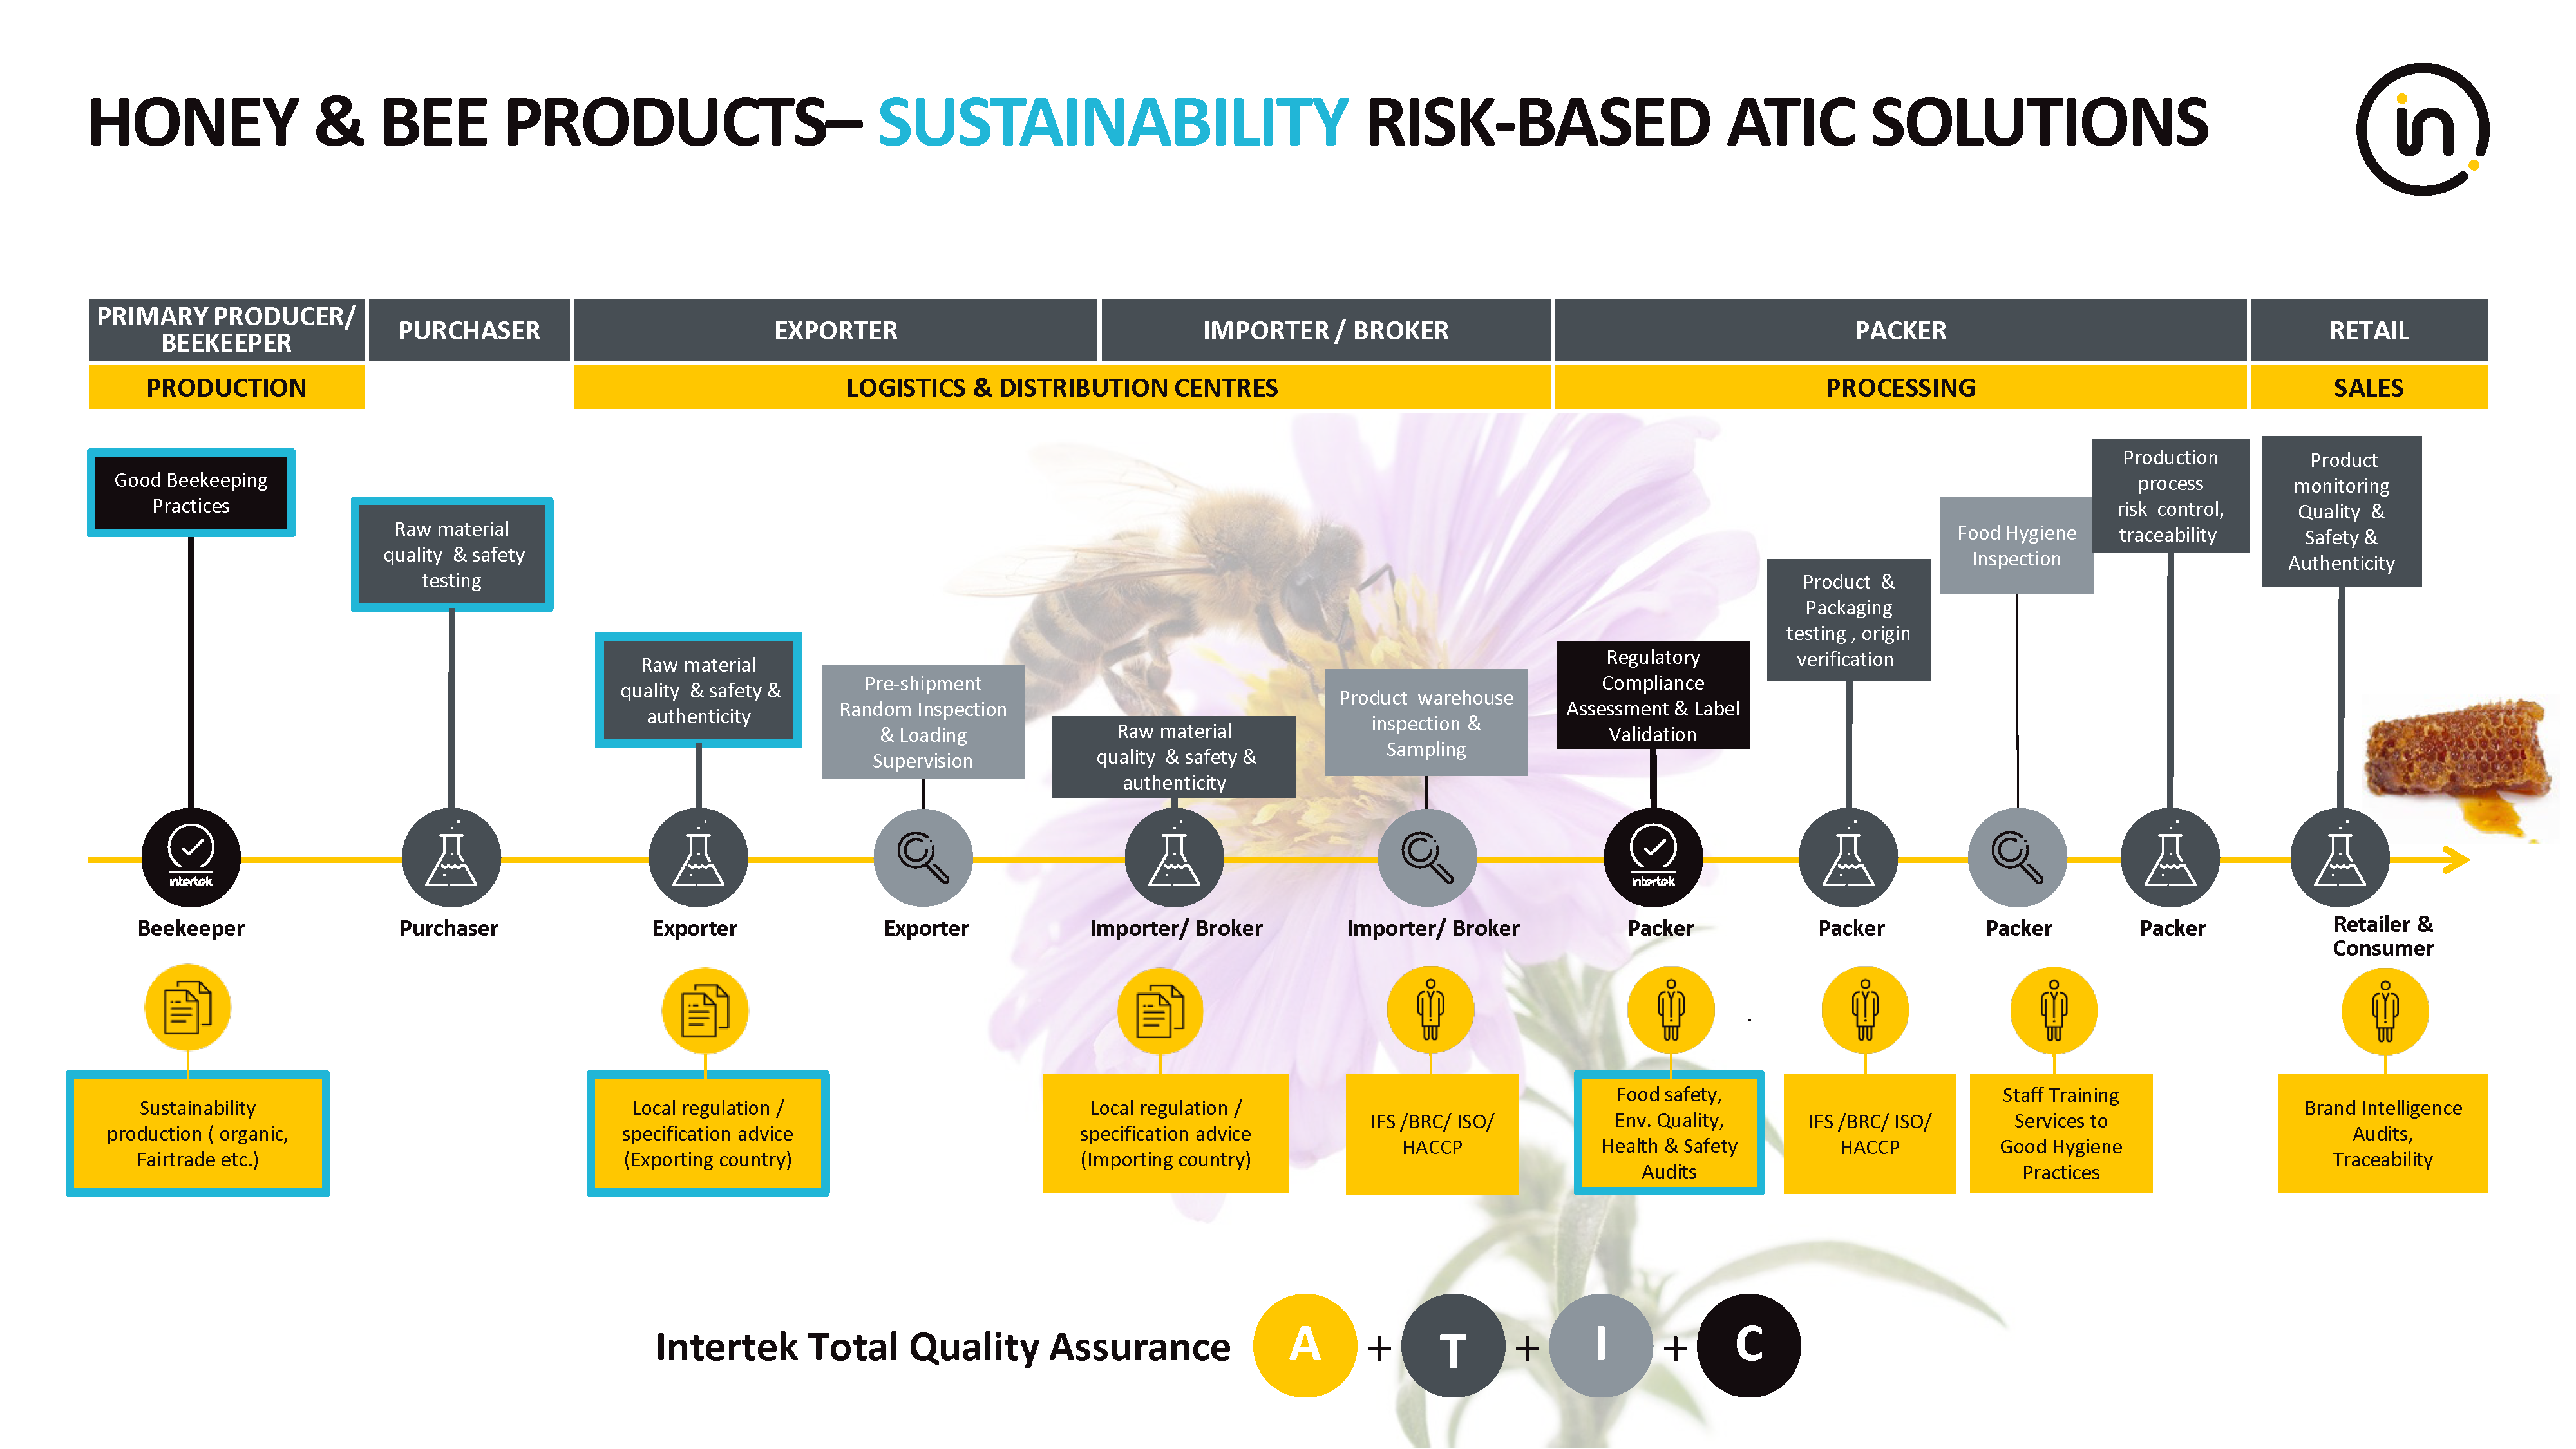
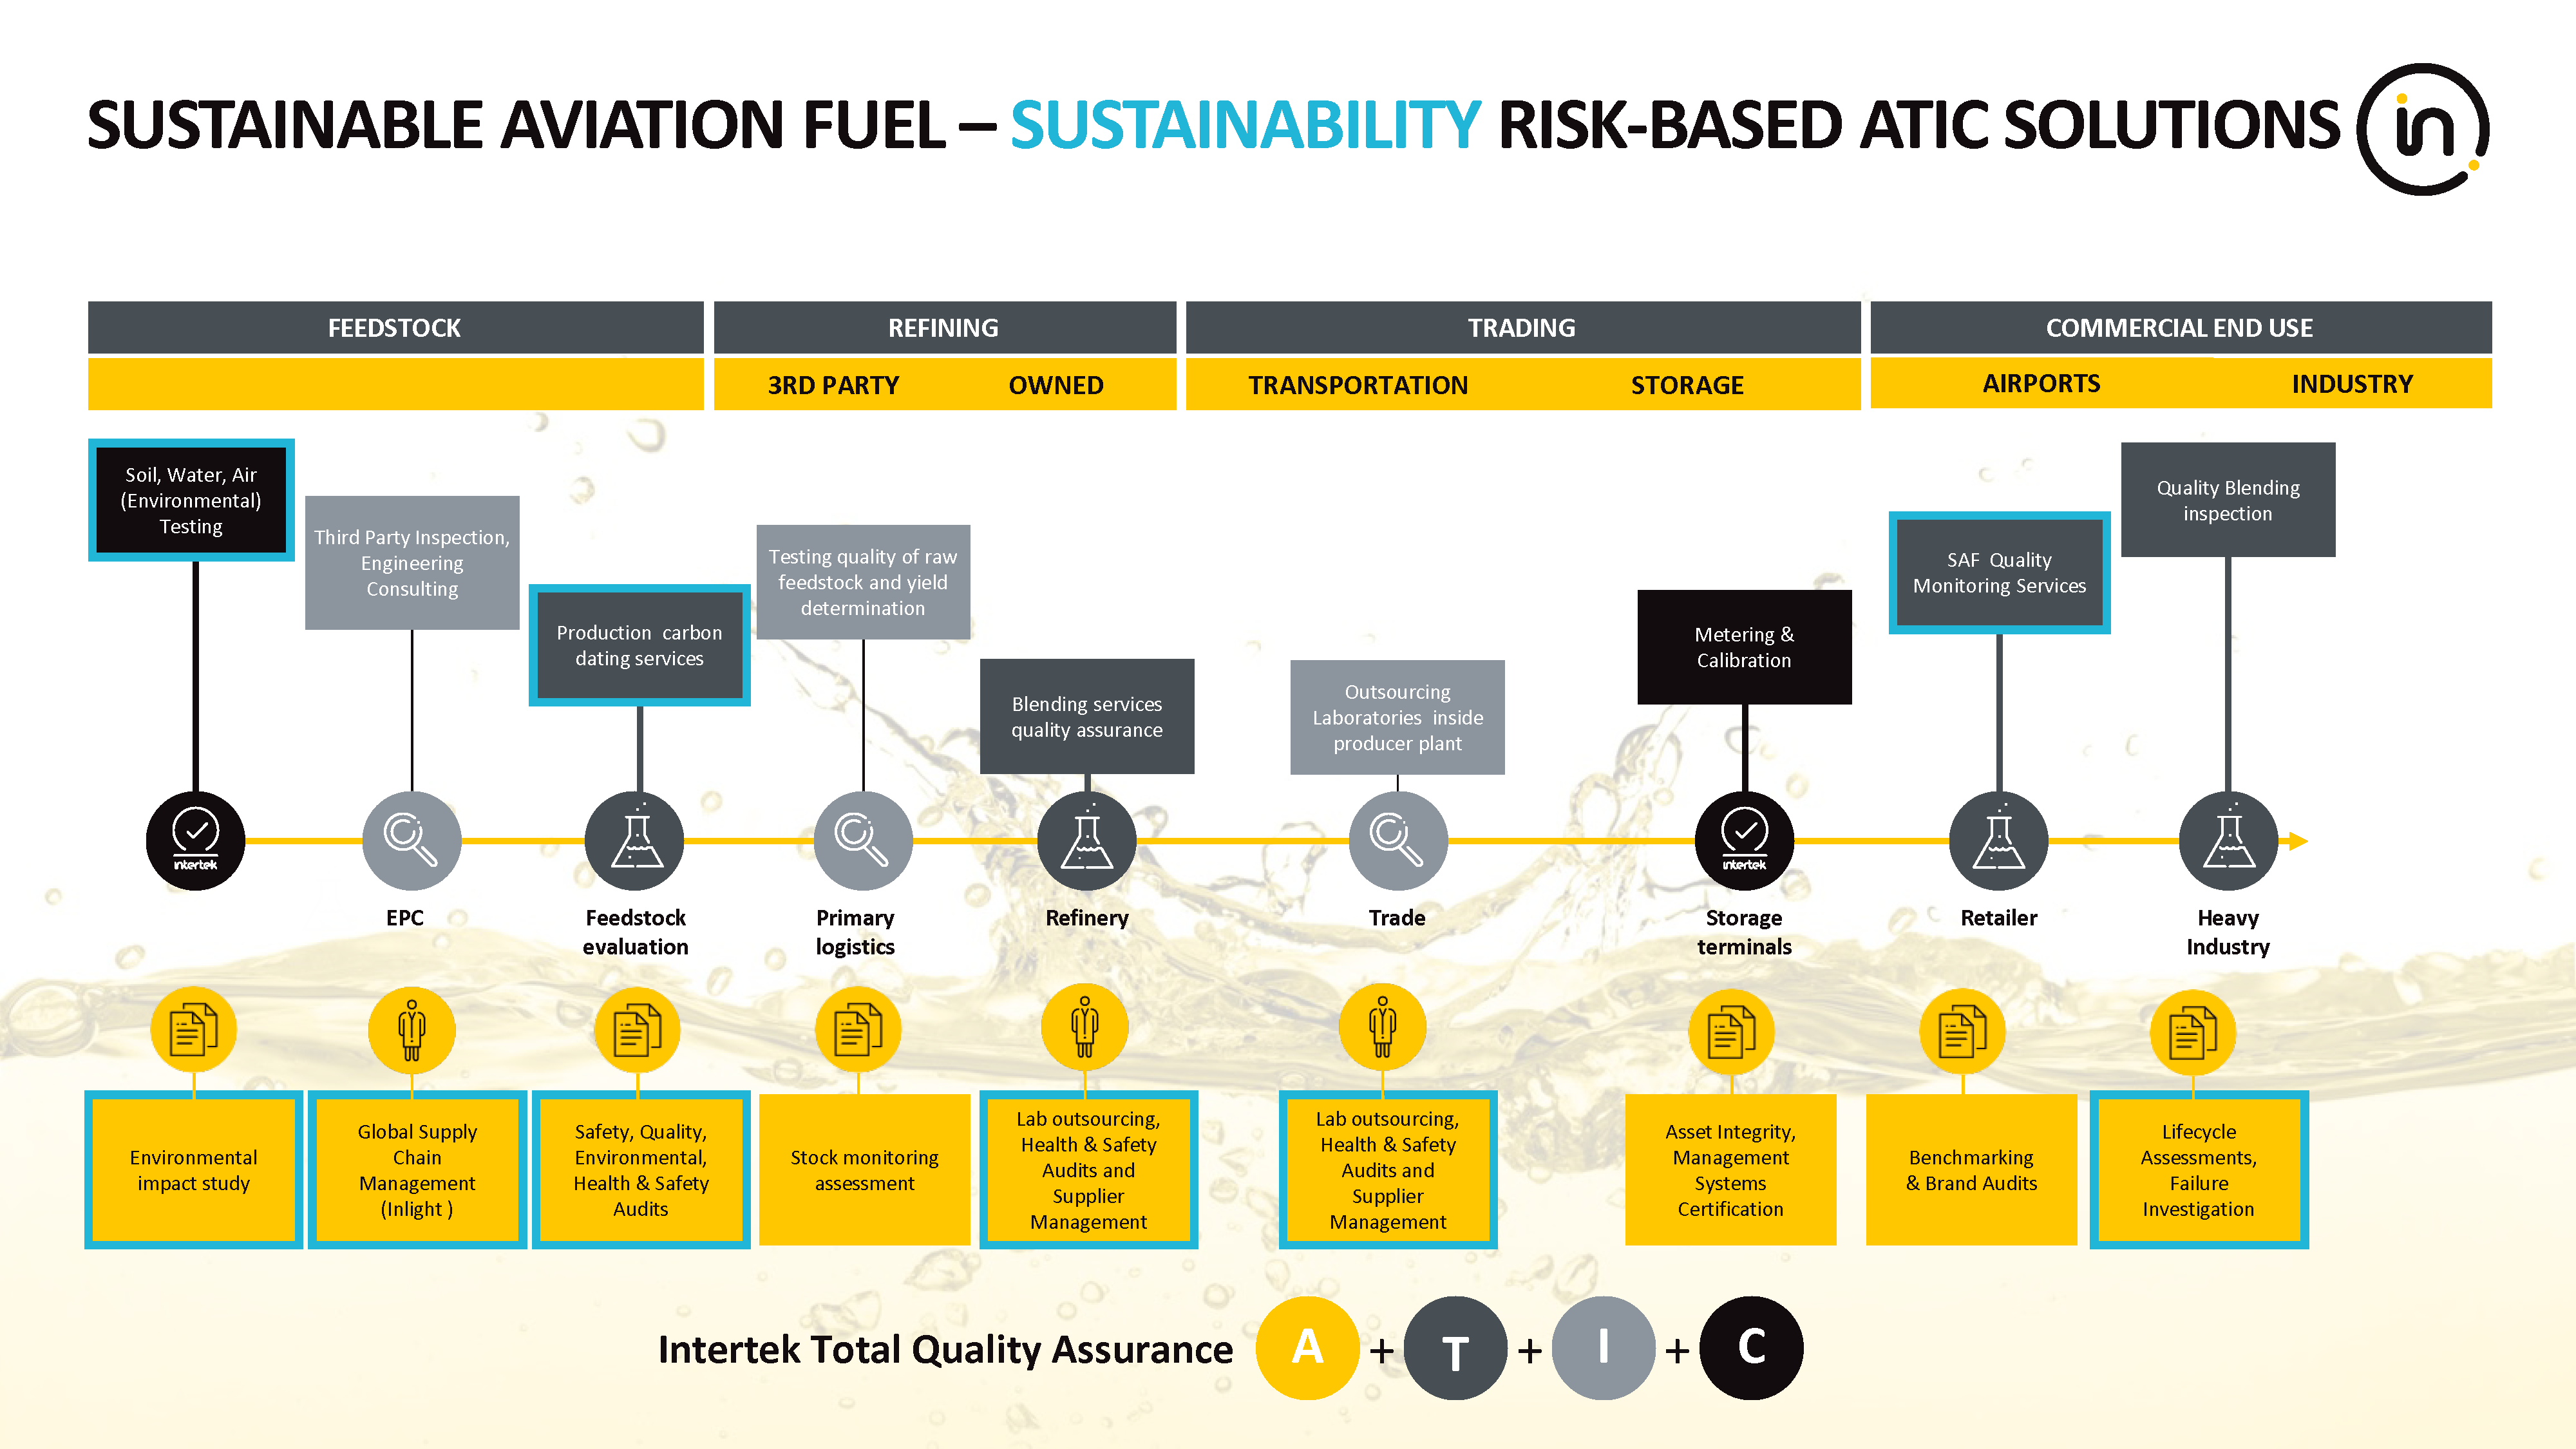
We provide ATIC solutions at every single stage of our clients’ operations. This is what we mean by Total Quality Assurance.
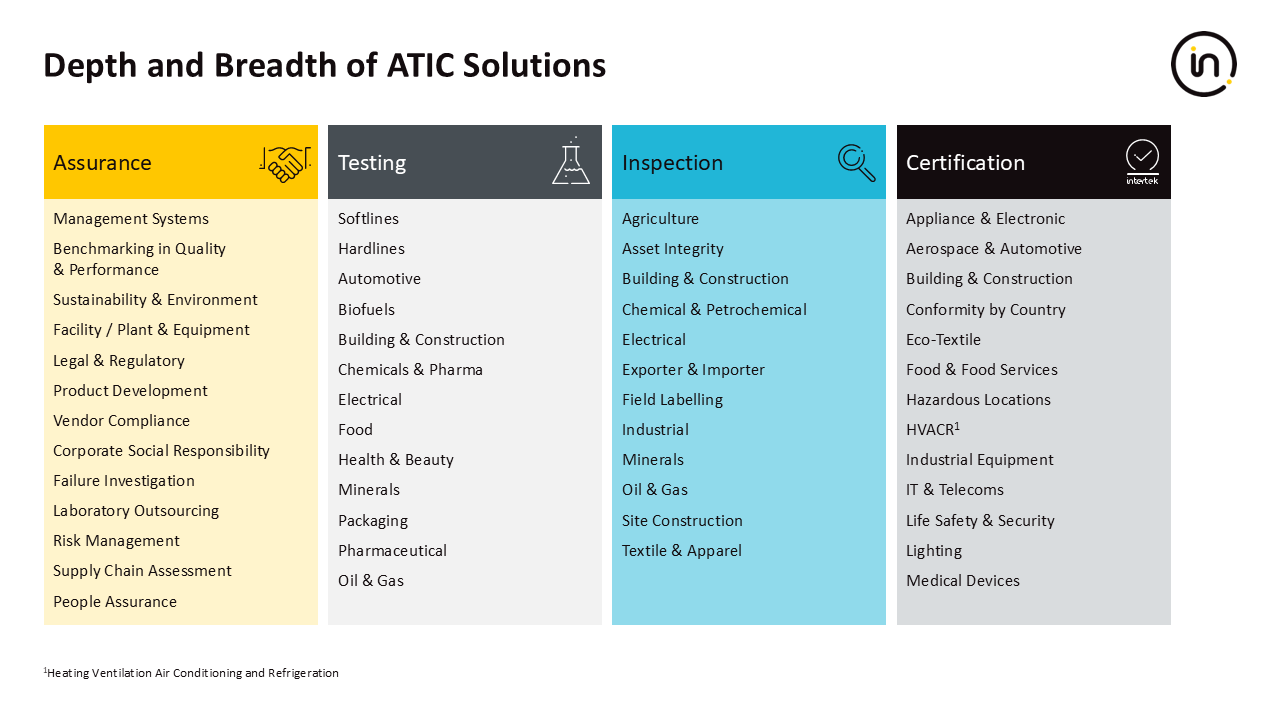
Our ATIC Solutions cover a wide range of industries across various points of the supply chain.
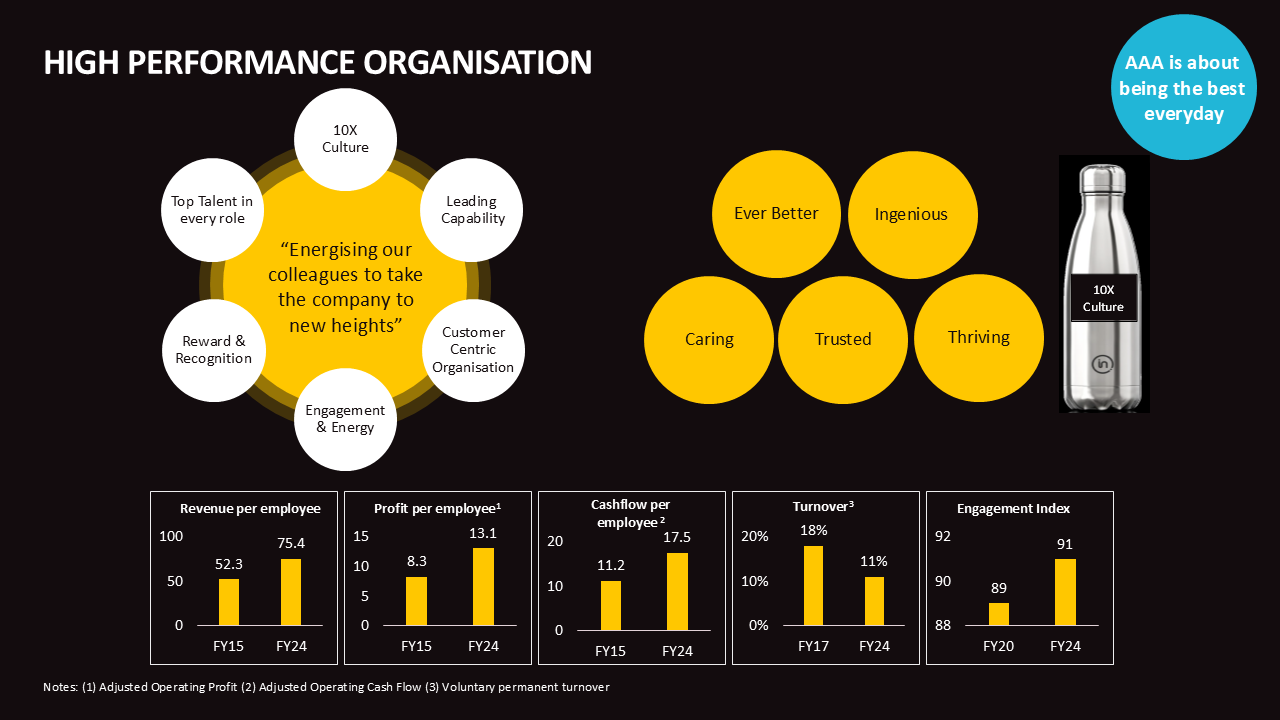
Intertek’s approach to being a high-performance organisation is through energising our colleagues to take the company to new heights. We put people at the heart of our growth strategy, our 10X culture is our DNA.
We have made significant progress on the metrics that define a high-performance organisation; revenue per employee, profit per employee, cash flow per employee, employee turnover, engagement.
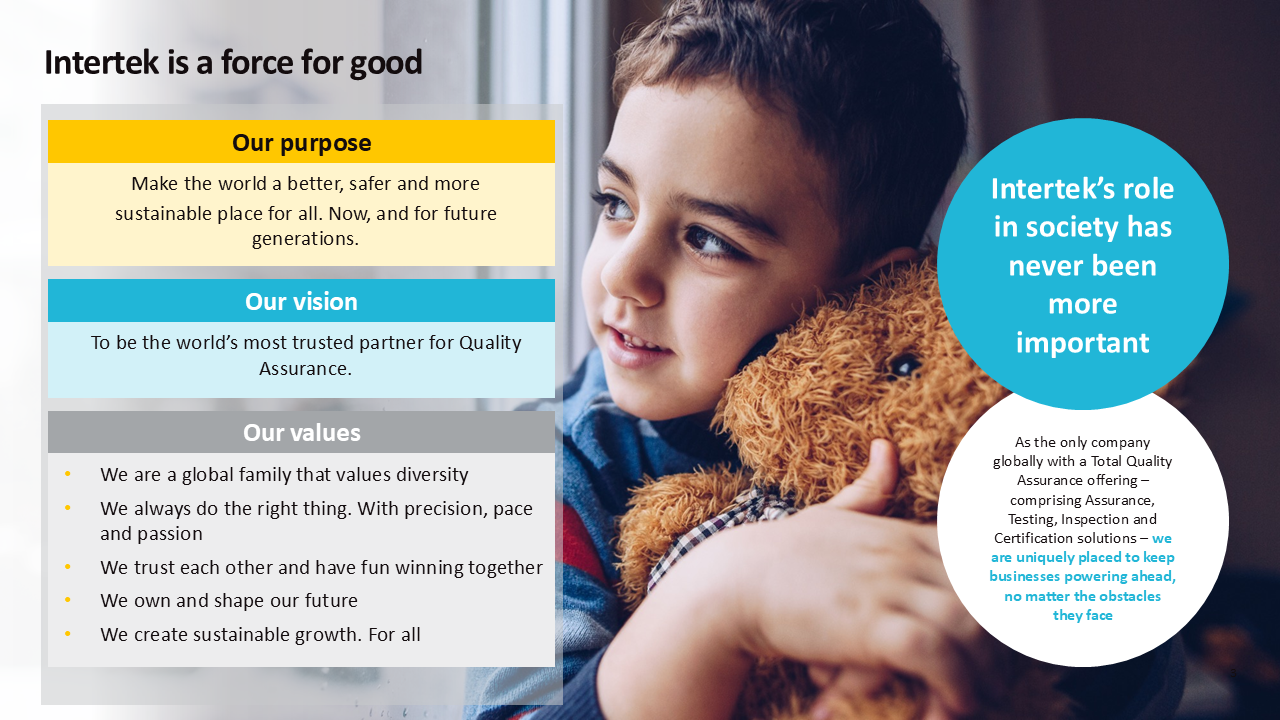
Intertek’s goal is to be the most trusted partner for Quality Assurance. This is weaved throughout our values of doing the right thing, trust and have fun winning, creating and shaping our own future and ultimately creating sustainable growth for all.
Assurance is the assessment of quality, safety and sustainability processes within company supply chains. With growing complexity in their nature, we provide an audit of company supply chains to identify and eliminate risks. This is done using real-time data which enables companies to detect issues instantly.
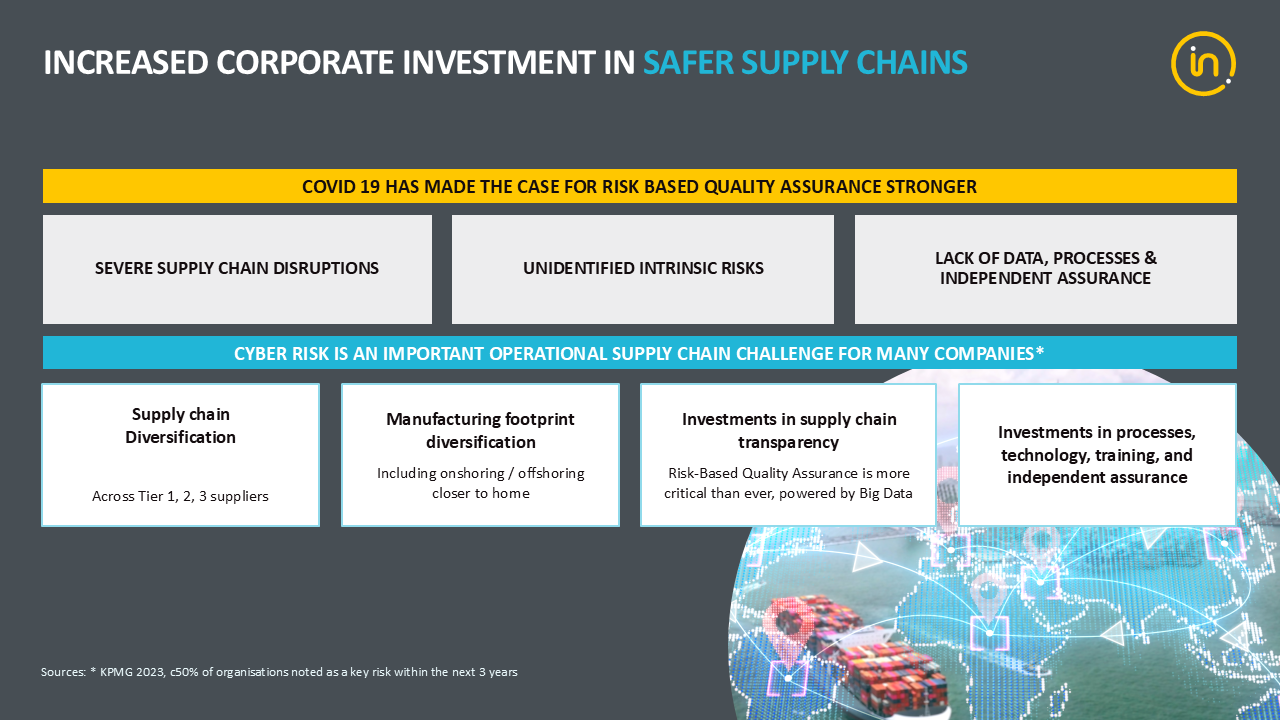
Covid-19 highlighted the fragility of global supply chains and the unidentified risks within them. As such, companies have been investing more in securing their supply chains, ensuring diversification. In addition, there has been increased investment in data protection, training and independent assurance.
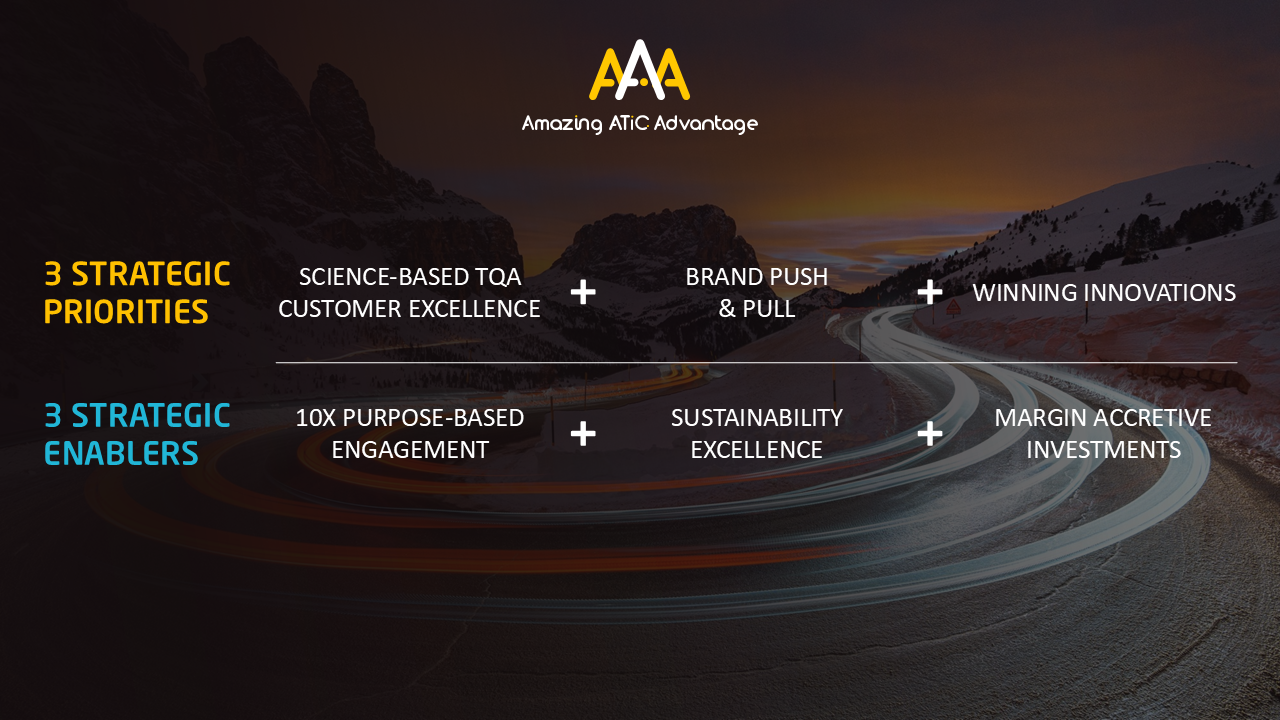
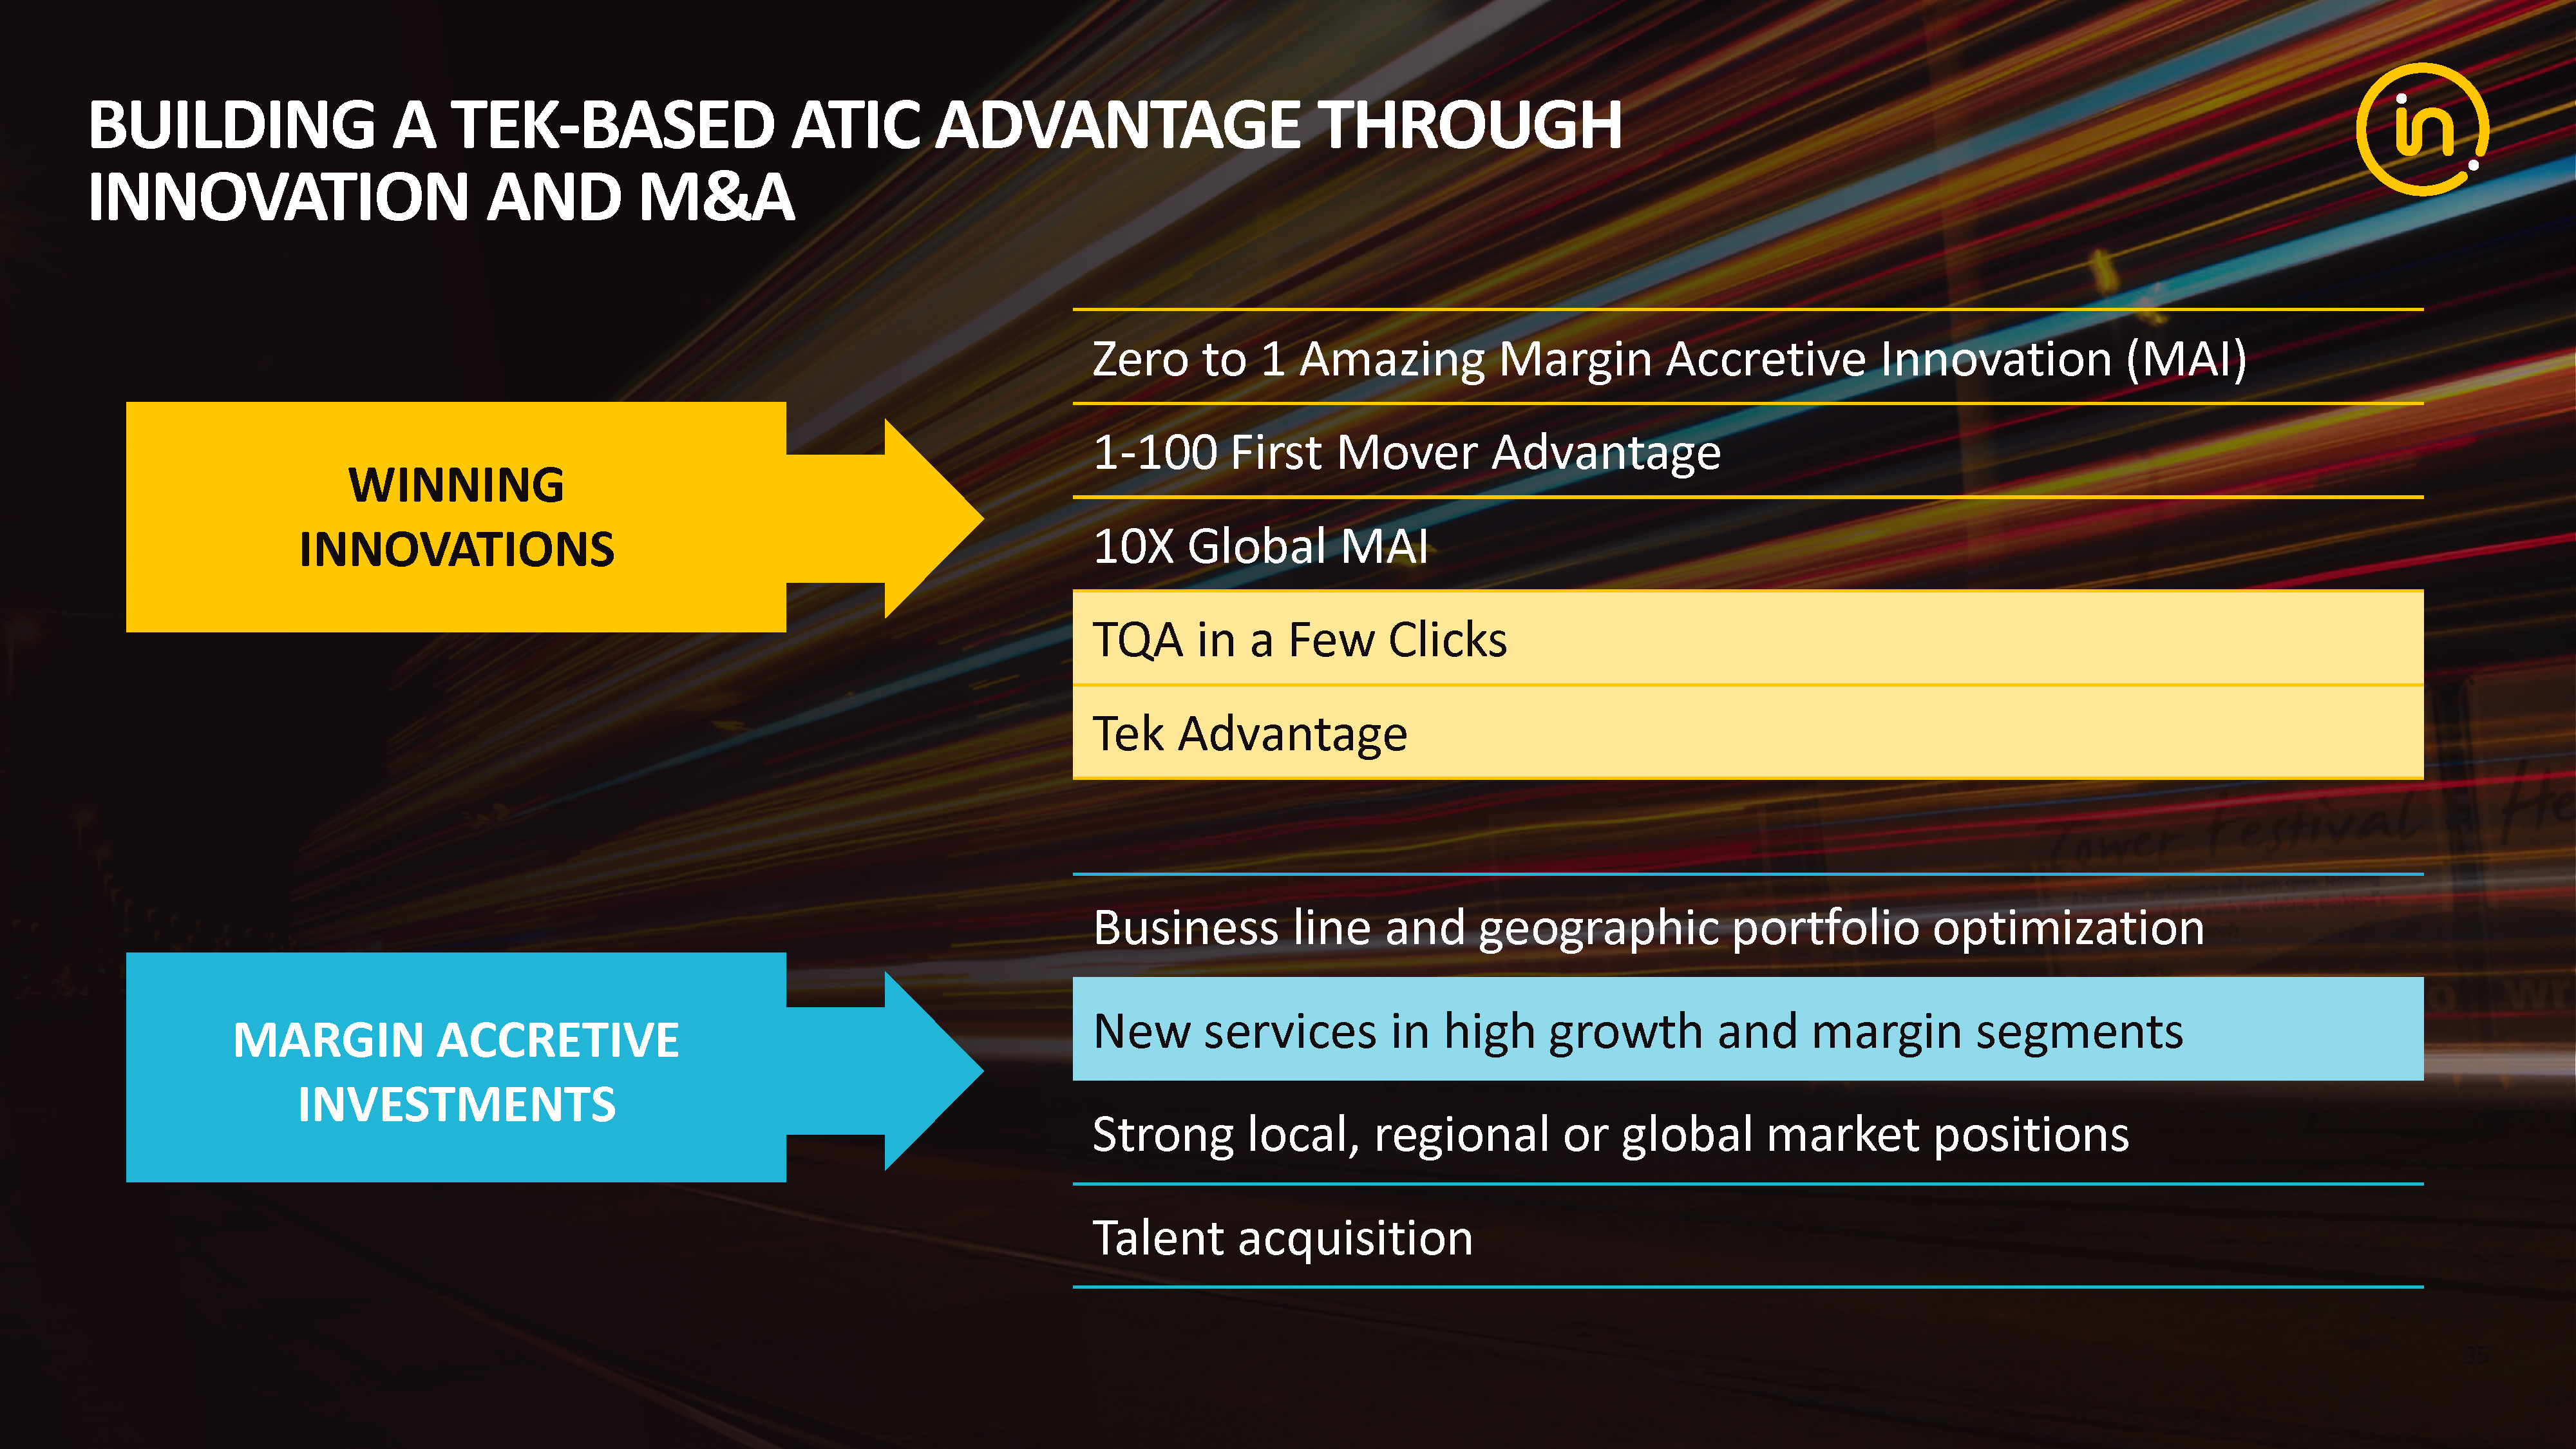
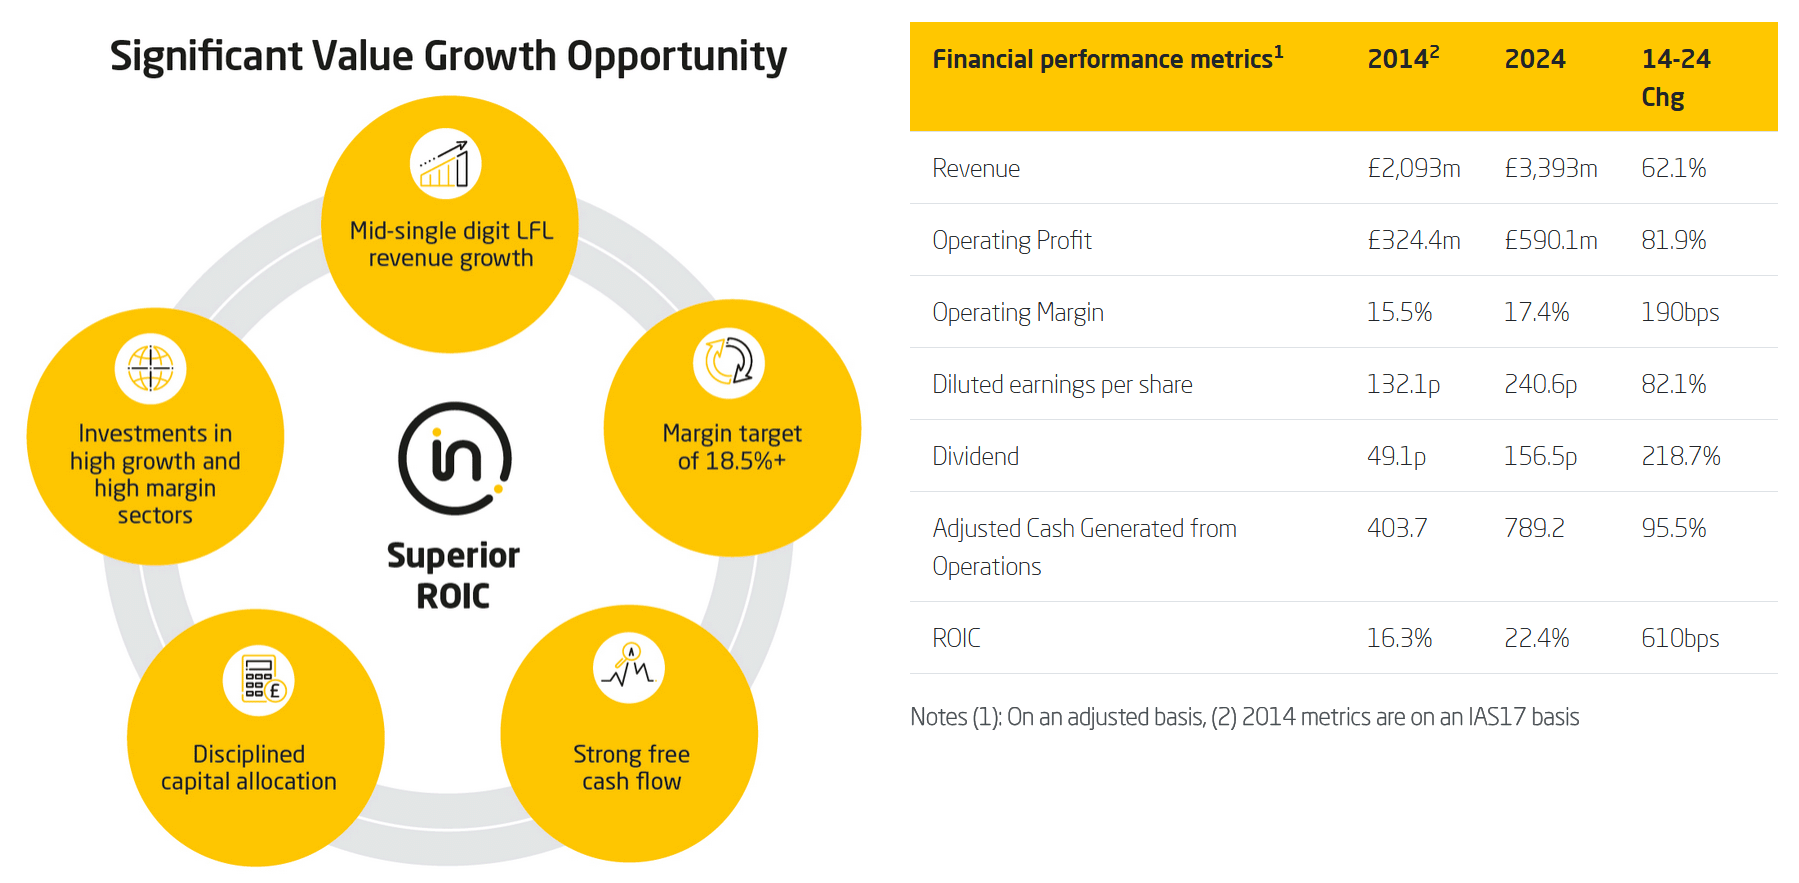
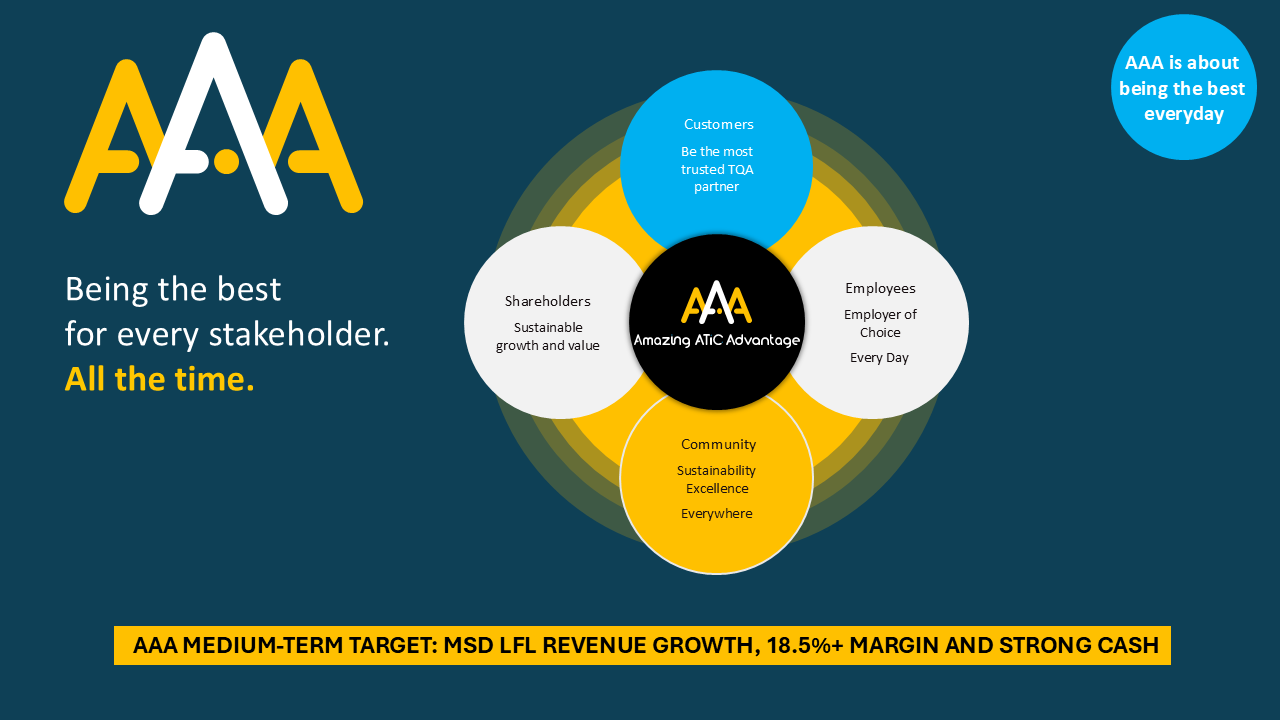
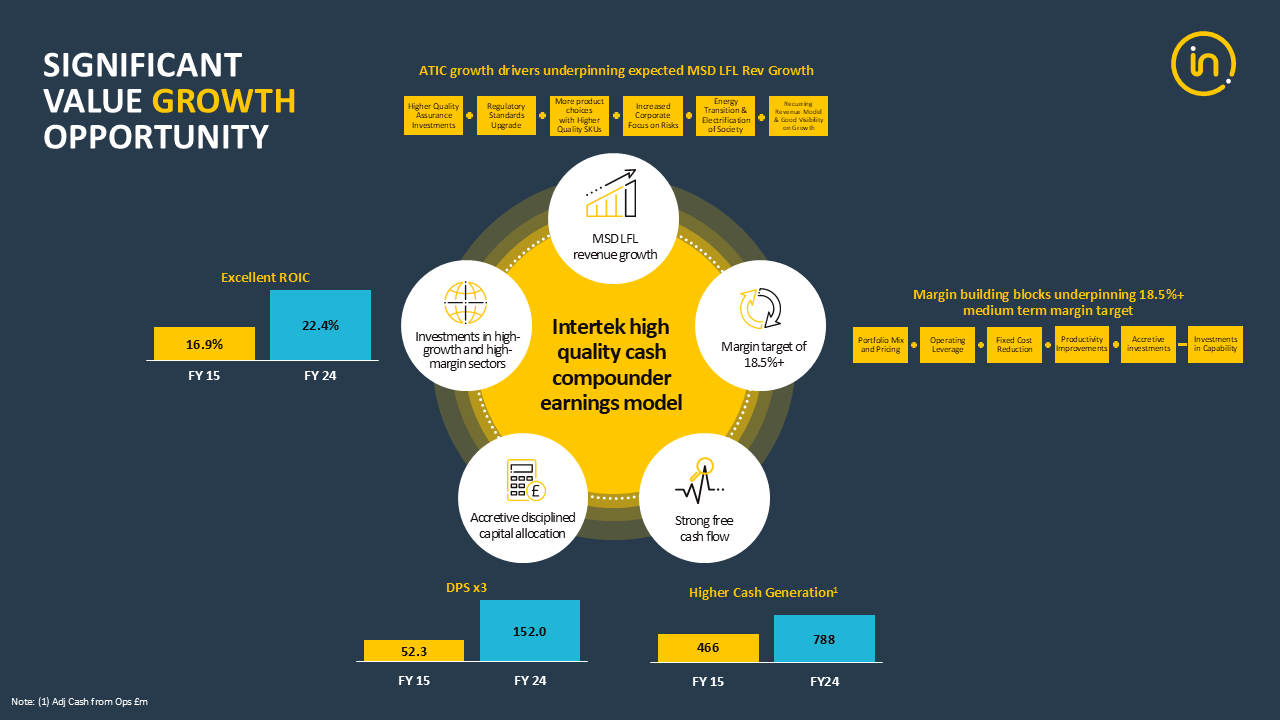
In 2023, as part of our Capital Markets event in London we launched our AAA growth strategy. The idea behind it was to deliver AAA value for all stakeholders and be the most trusted partner for Total Quality Assurance. Our aim was to deliver MSD LFL revenue growth at CCY, margin accretive revenue growth (18.5%+ margin target, announced at our FY24 results), strong FCF, and disciplined capital allocation in high growth and high margin sectors.
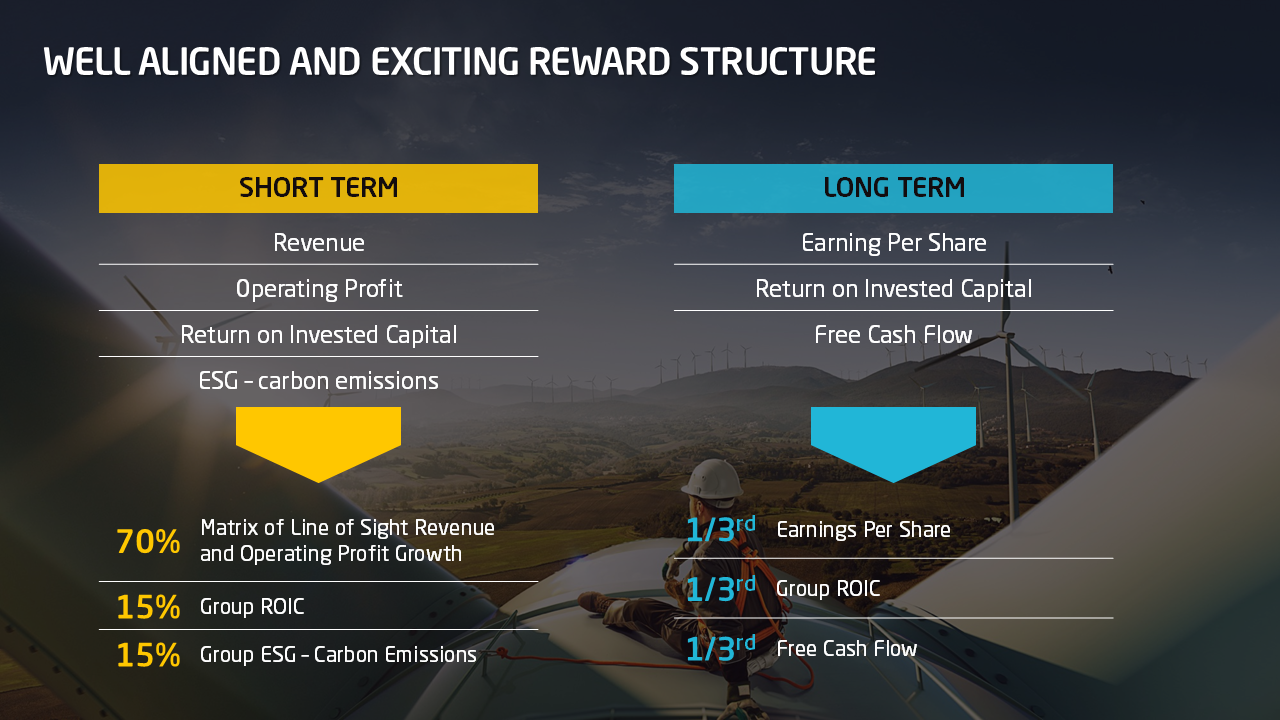
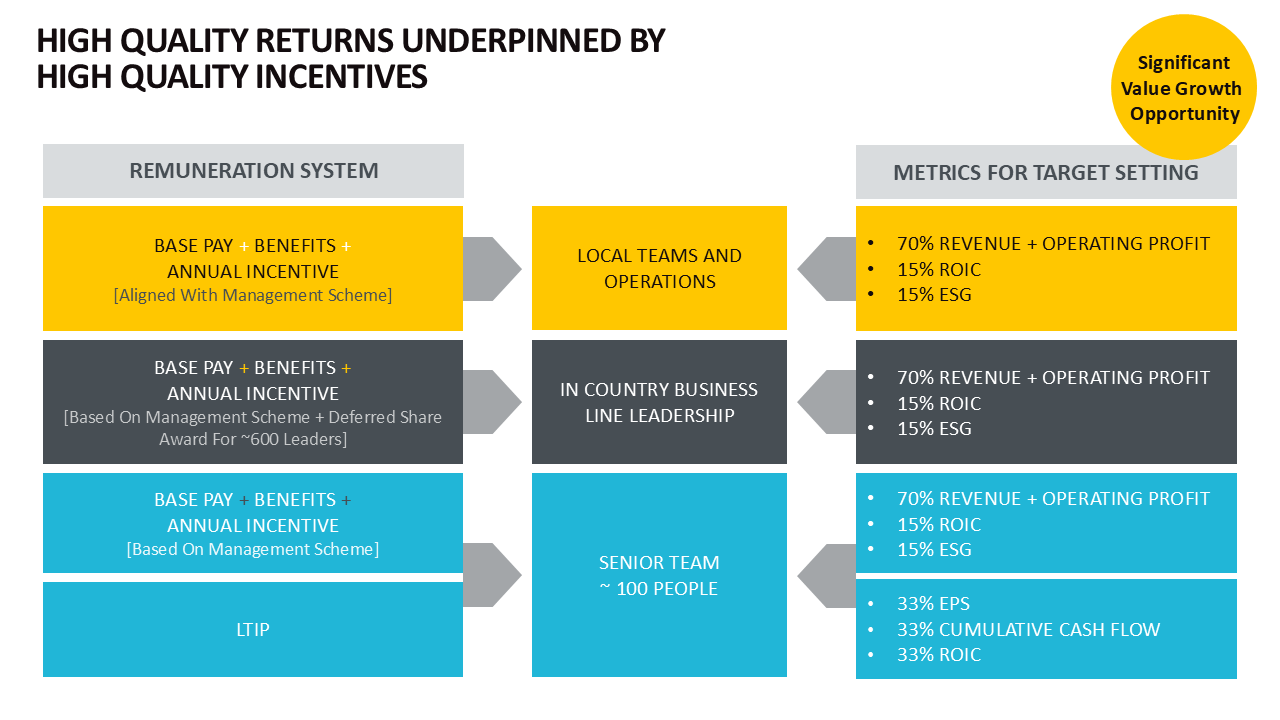
To better align management priorities with that of stakeholders, incentives are aligned to short-term and long-term financial and sustainability metrics.
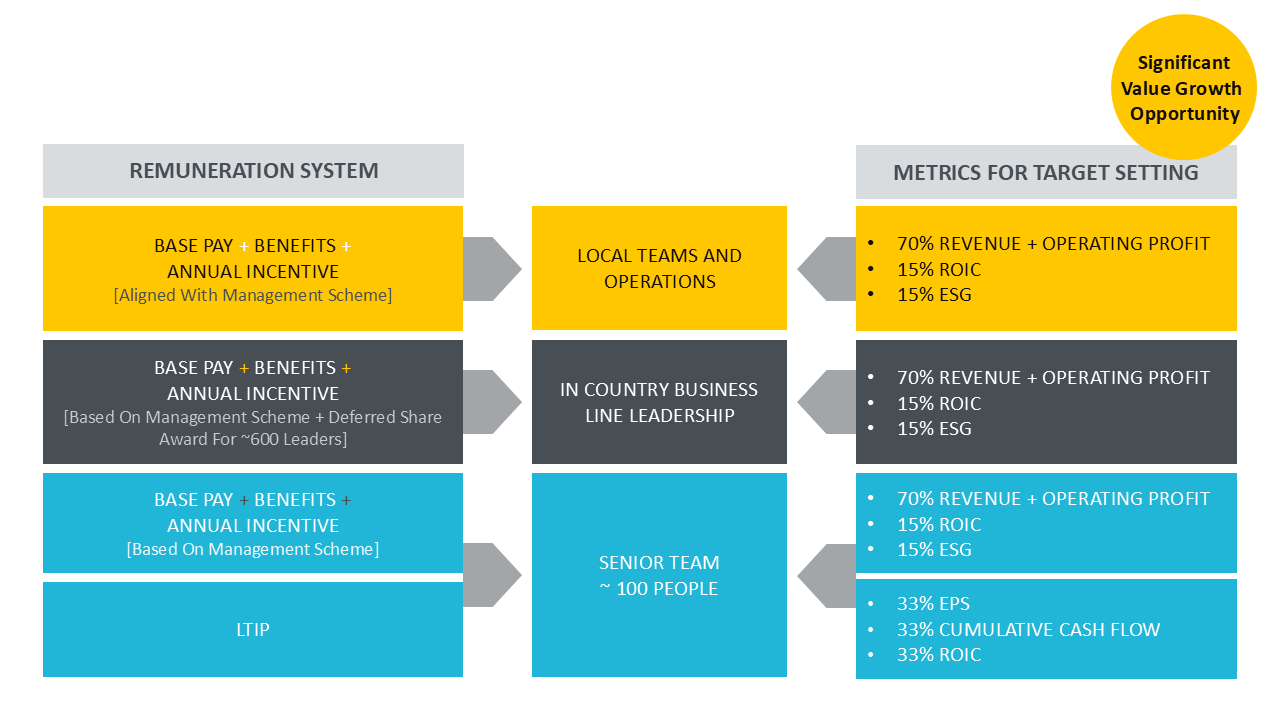
The reward structure is broken down that 70% of the short-term incentive is on a line-of-sight matrix of Revenue and Operating Profit while the balance is split between Group ROIC and Group ESG metrics. The long‐term incentive performance share program is based on a 3‐year performance cycle with a 2 year post vesting holding period. This is based equally on EPS, ROIC and FCF. We believe that having long-term incentives ensures the alignment with all stakeholders.
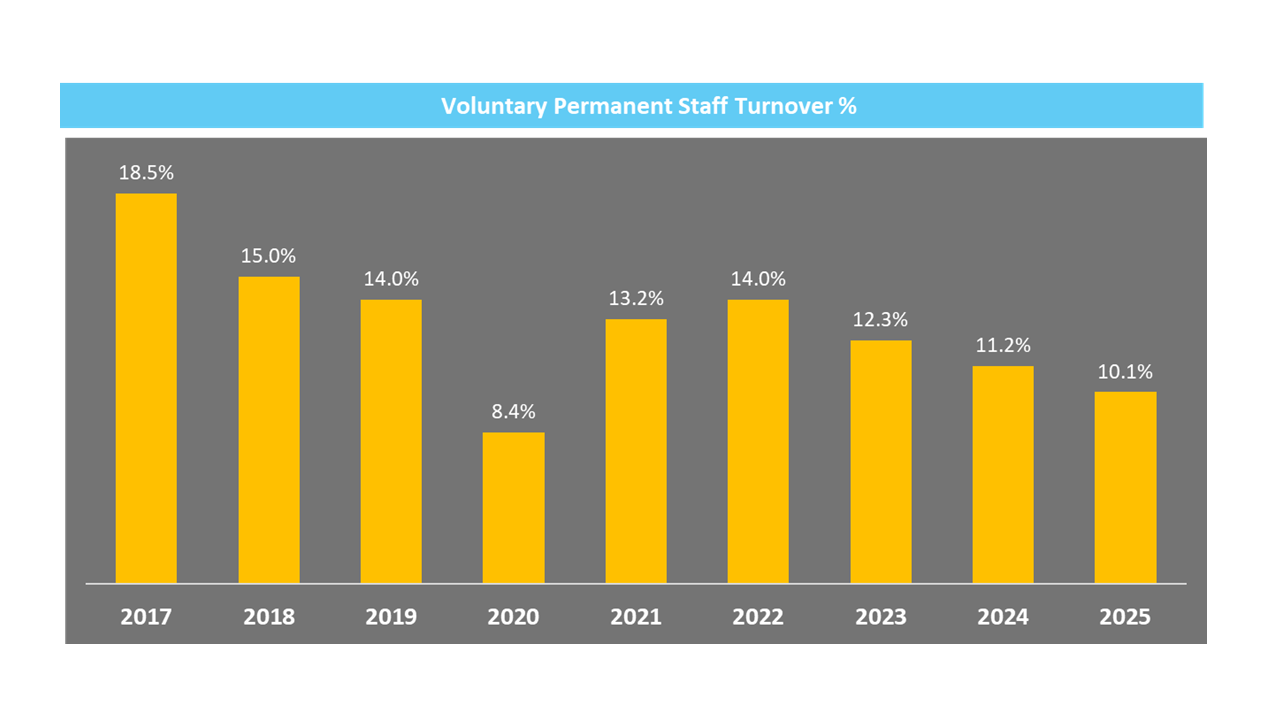
Since launching our people strategy in 2016, our voluntary employee turnover has come down from 18.5% in 2017 to 10.1% in 2025.
Divisions & Growth Opportunities
We expect to deliver Mid-Single Digit Revenue growth on a like-for-like basis for the mid-to long-term. We are targeting high-single digit to double-digit growth in Corporate Assurance, MSD to HSD growth in Health and Safety and Industry and Infrastructure, MSD growth in Consumer Products, and Low to MSD growth in World of Energy.
Our unique Assurance, Testing, Inspection and Certification (ATIC) offering means we are well-placed to take advantage of the huge growth opportunities in the global ATIC market.
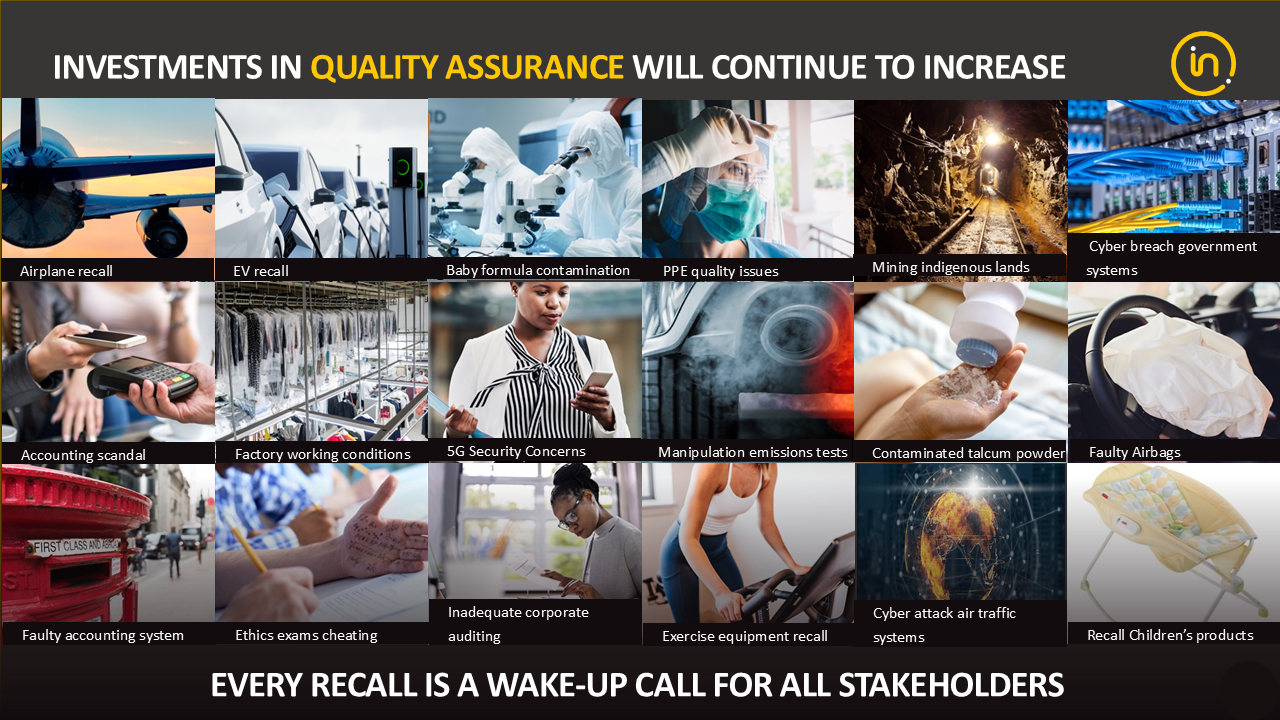
Our industry has always benefitted from attractive growth drivers and now, more than ever, everyone wants to build an ever better, safer and more sustainable world. This means that corporations will invest more in quality, safety and sustainability, accelerating the demand for our industry-leading ATIC solutions.
Our customer research shows that the well-known attractive structural growth drivers in the Risk-based Quality Assurance industry will be augmented by:
- higher investments in safer and more resilient supply chains.
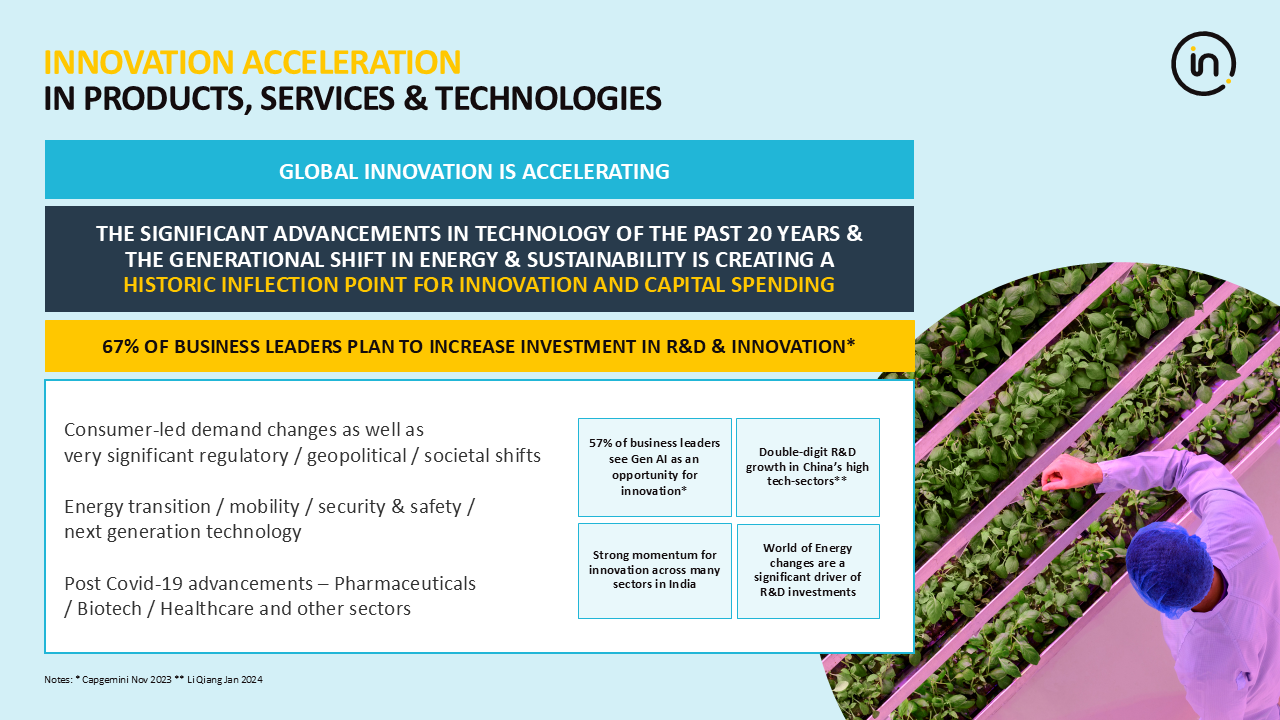
- continuous investments by corporations in innovation in new products and services.
- a step change in how companies manage sustainability.
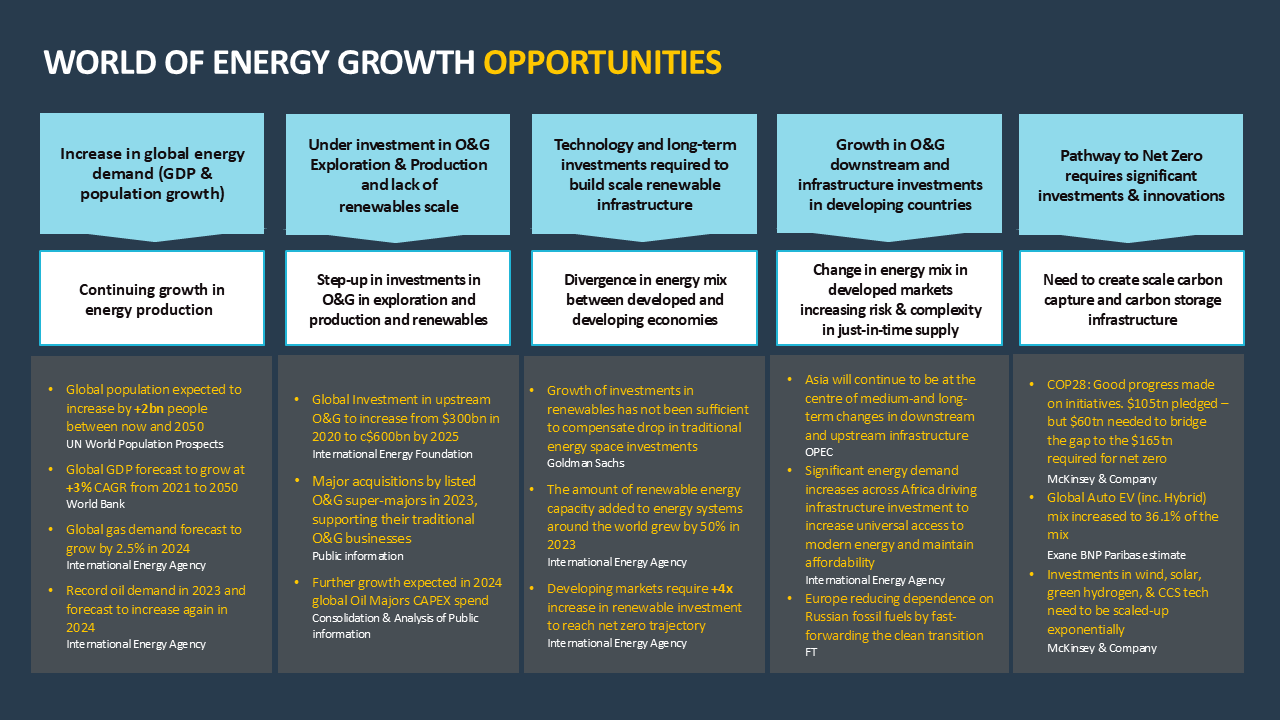
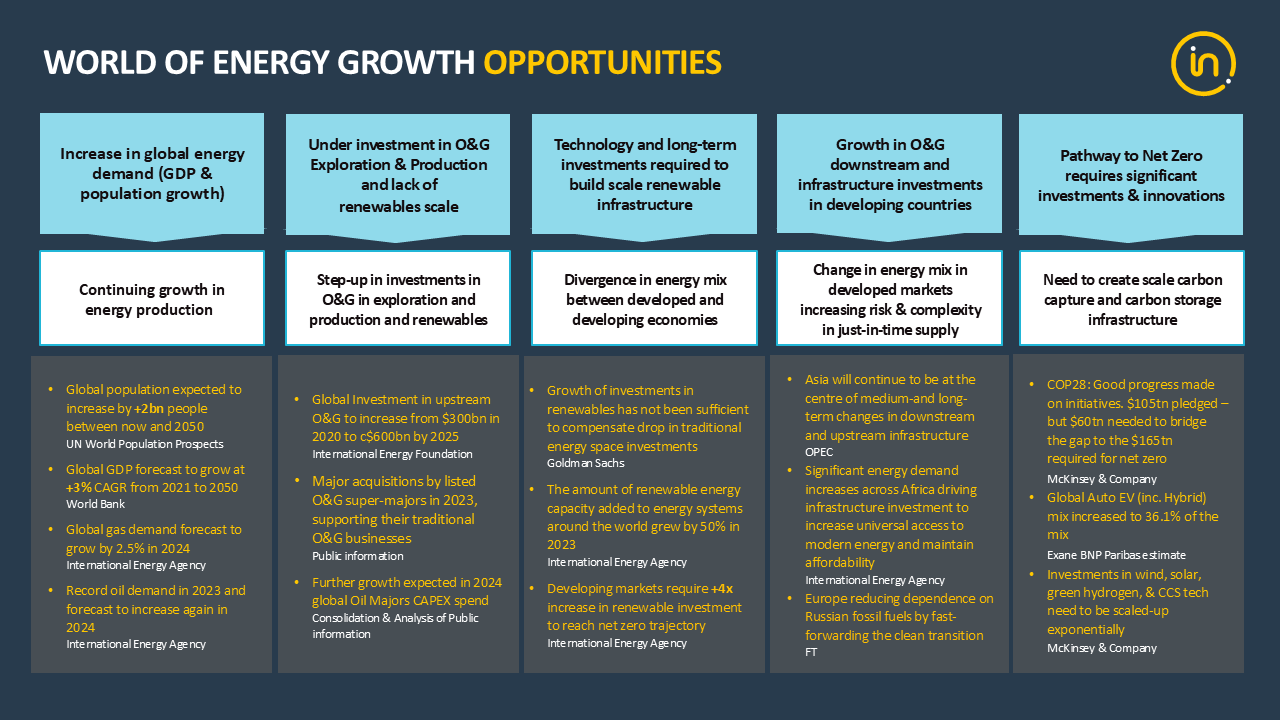
- increased investments in traditional oil & gas and renewables.
- an increase in new clients, both in developed and emerging economies.
Our ATIC solutions ensure an end-to-end assessment of the risks within supply chains, ensuring superior customer service to clients. The whole ATIC offering assesses internal and third-party supply chain risks while also providing our Testing, Inspection and Certification services.
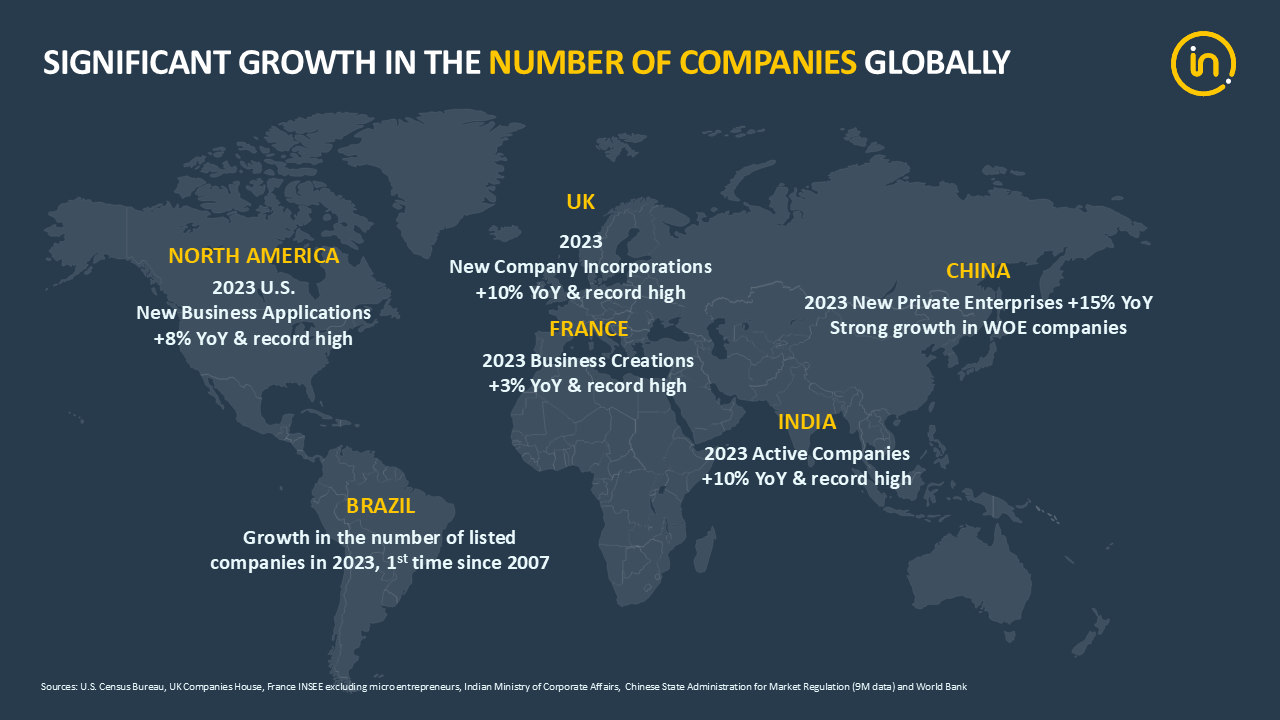
Over the past number of years we have seen a significant increase in the number of SKUs globally, which has been driven by the growth in the number of companies. Lower barriers to entry across many industries have enabled this significant growth.
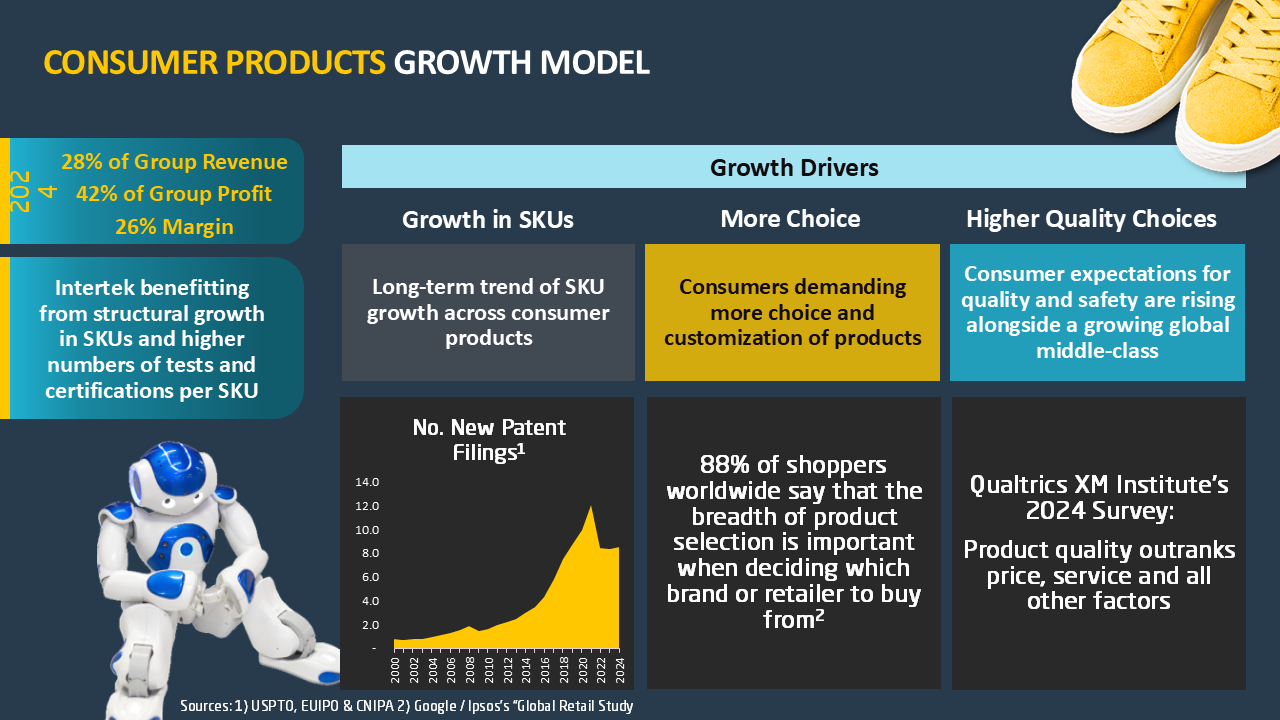
The structural growth drivers in the Consumer business are very exciting. The more SKUs we test, the increased revenue potential, and in a world where consumers want more choice, the global SKU expansion witnessed in recent decades.
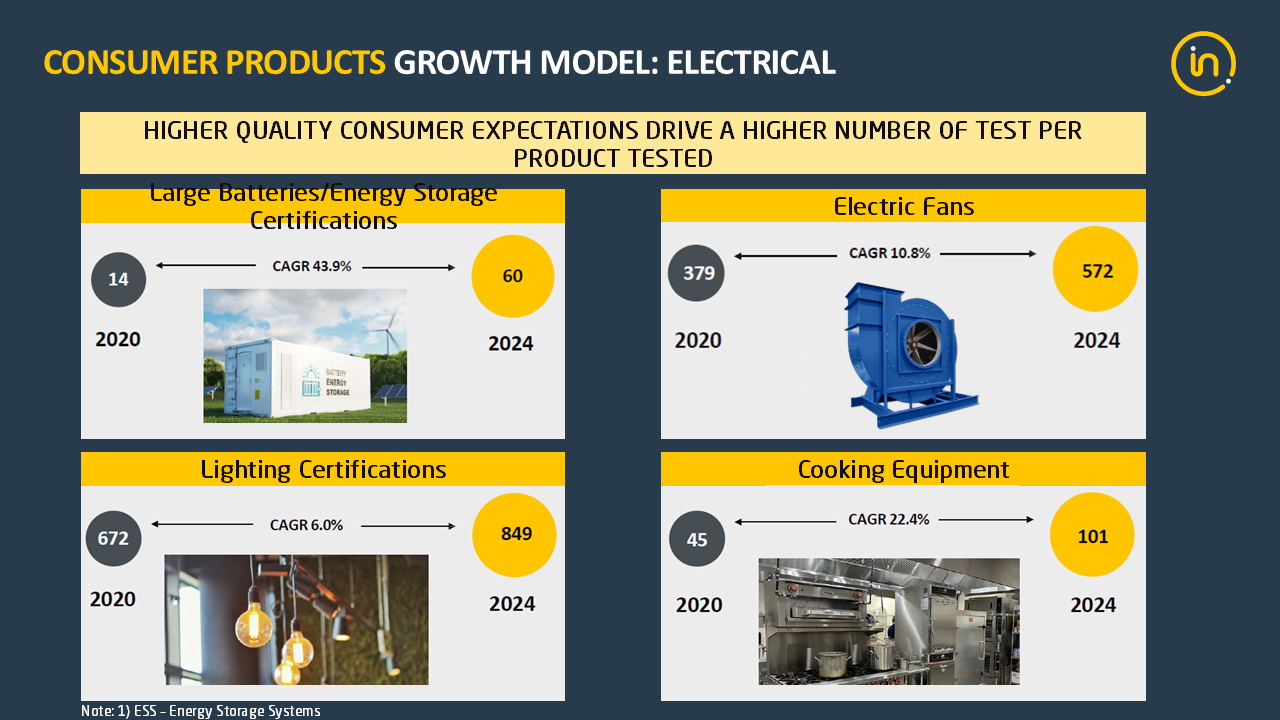
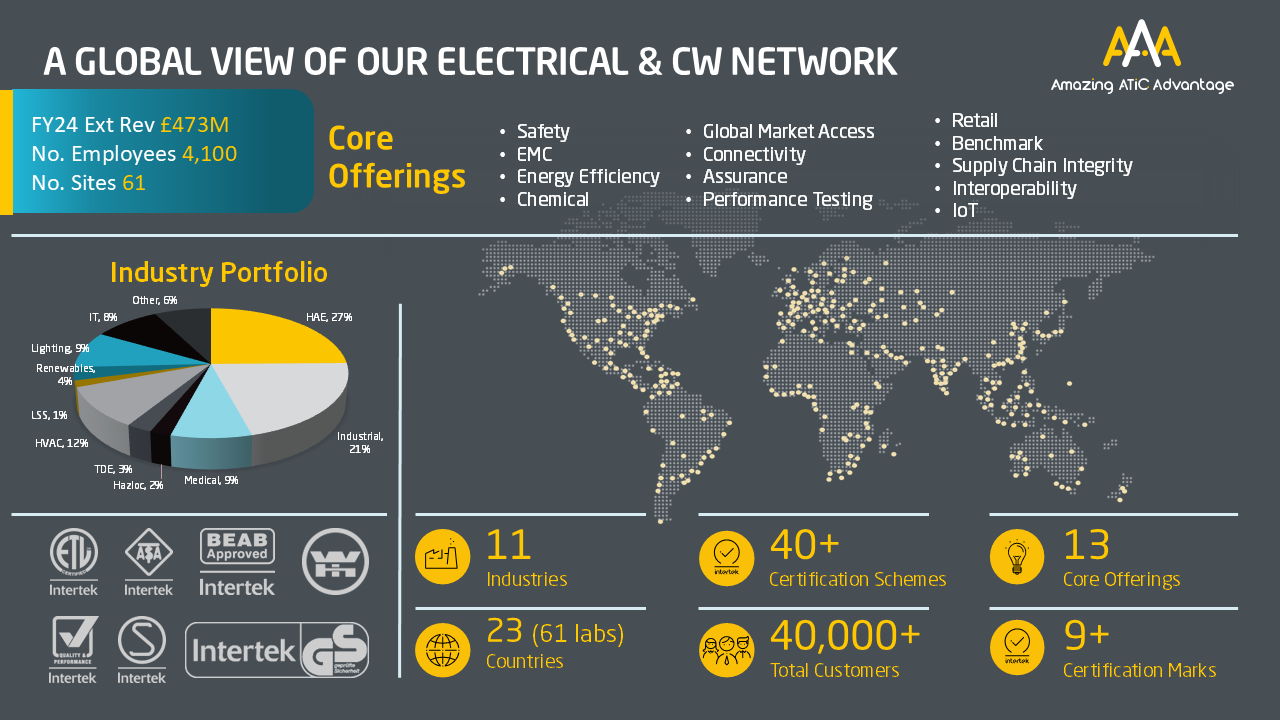
Our portfolio within the Electrical division expands beyond the Consumer business and spans across 11 industries in 23 countries. With 16 labs in the US, we maintain a podium position in this market.
Our offering ranges from ATIC services in Industrial to HVAC and Medical, where we ensure product safety and regulatory compliance throughout the entire product lifecycle.
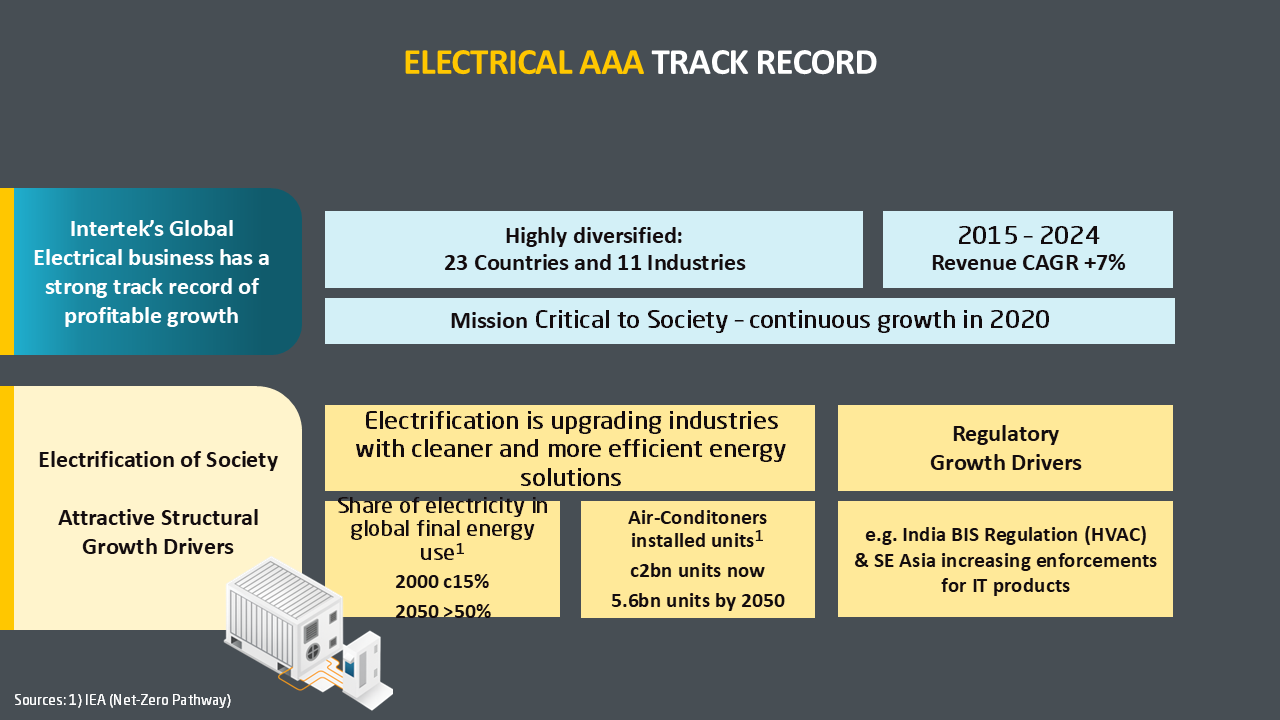
Growth potential in Energy-related activities is driven by the increasing shift towards renewables and the path to net zero. In addition, traditional energy activities remain an integral part of our revenue.
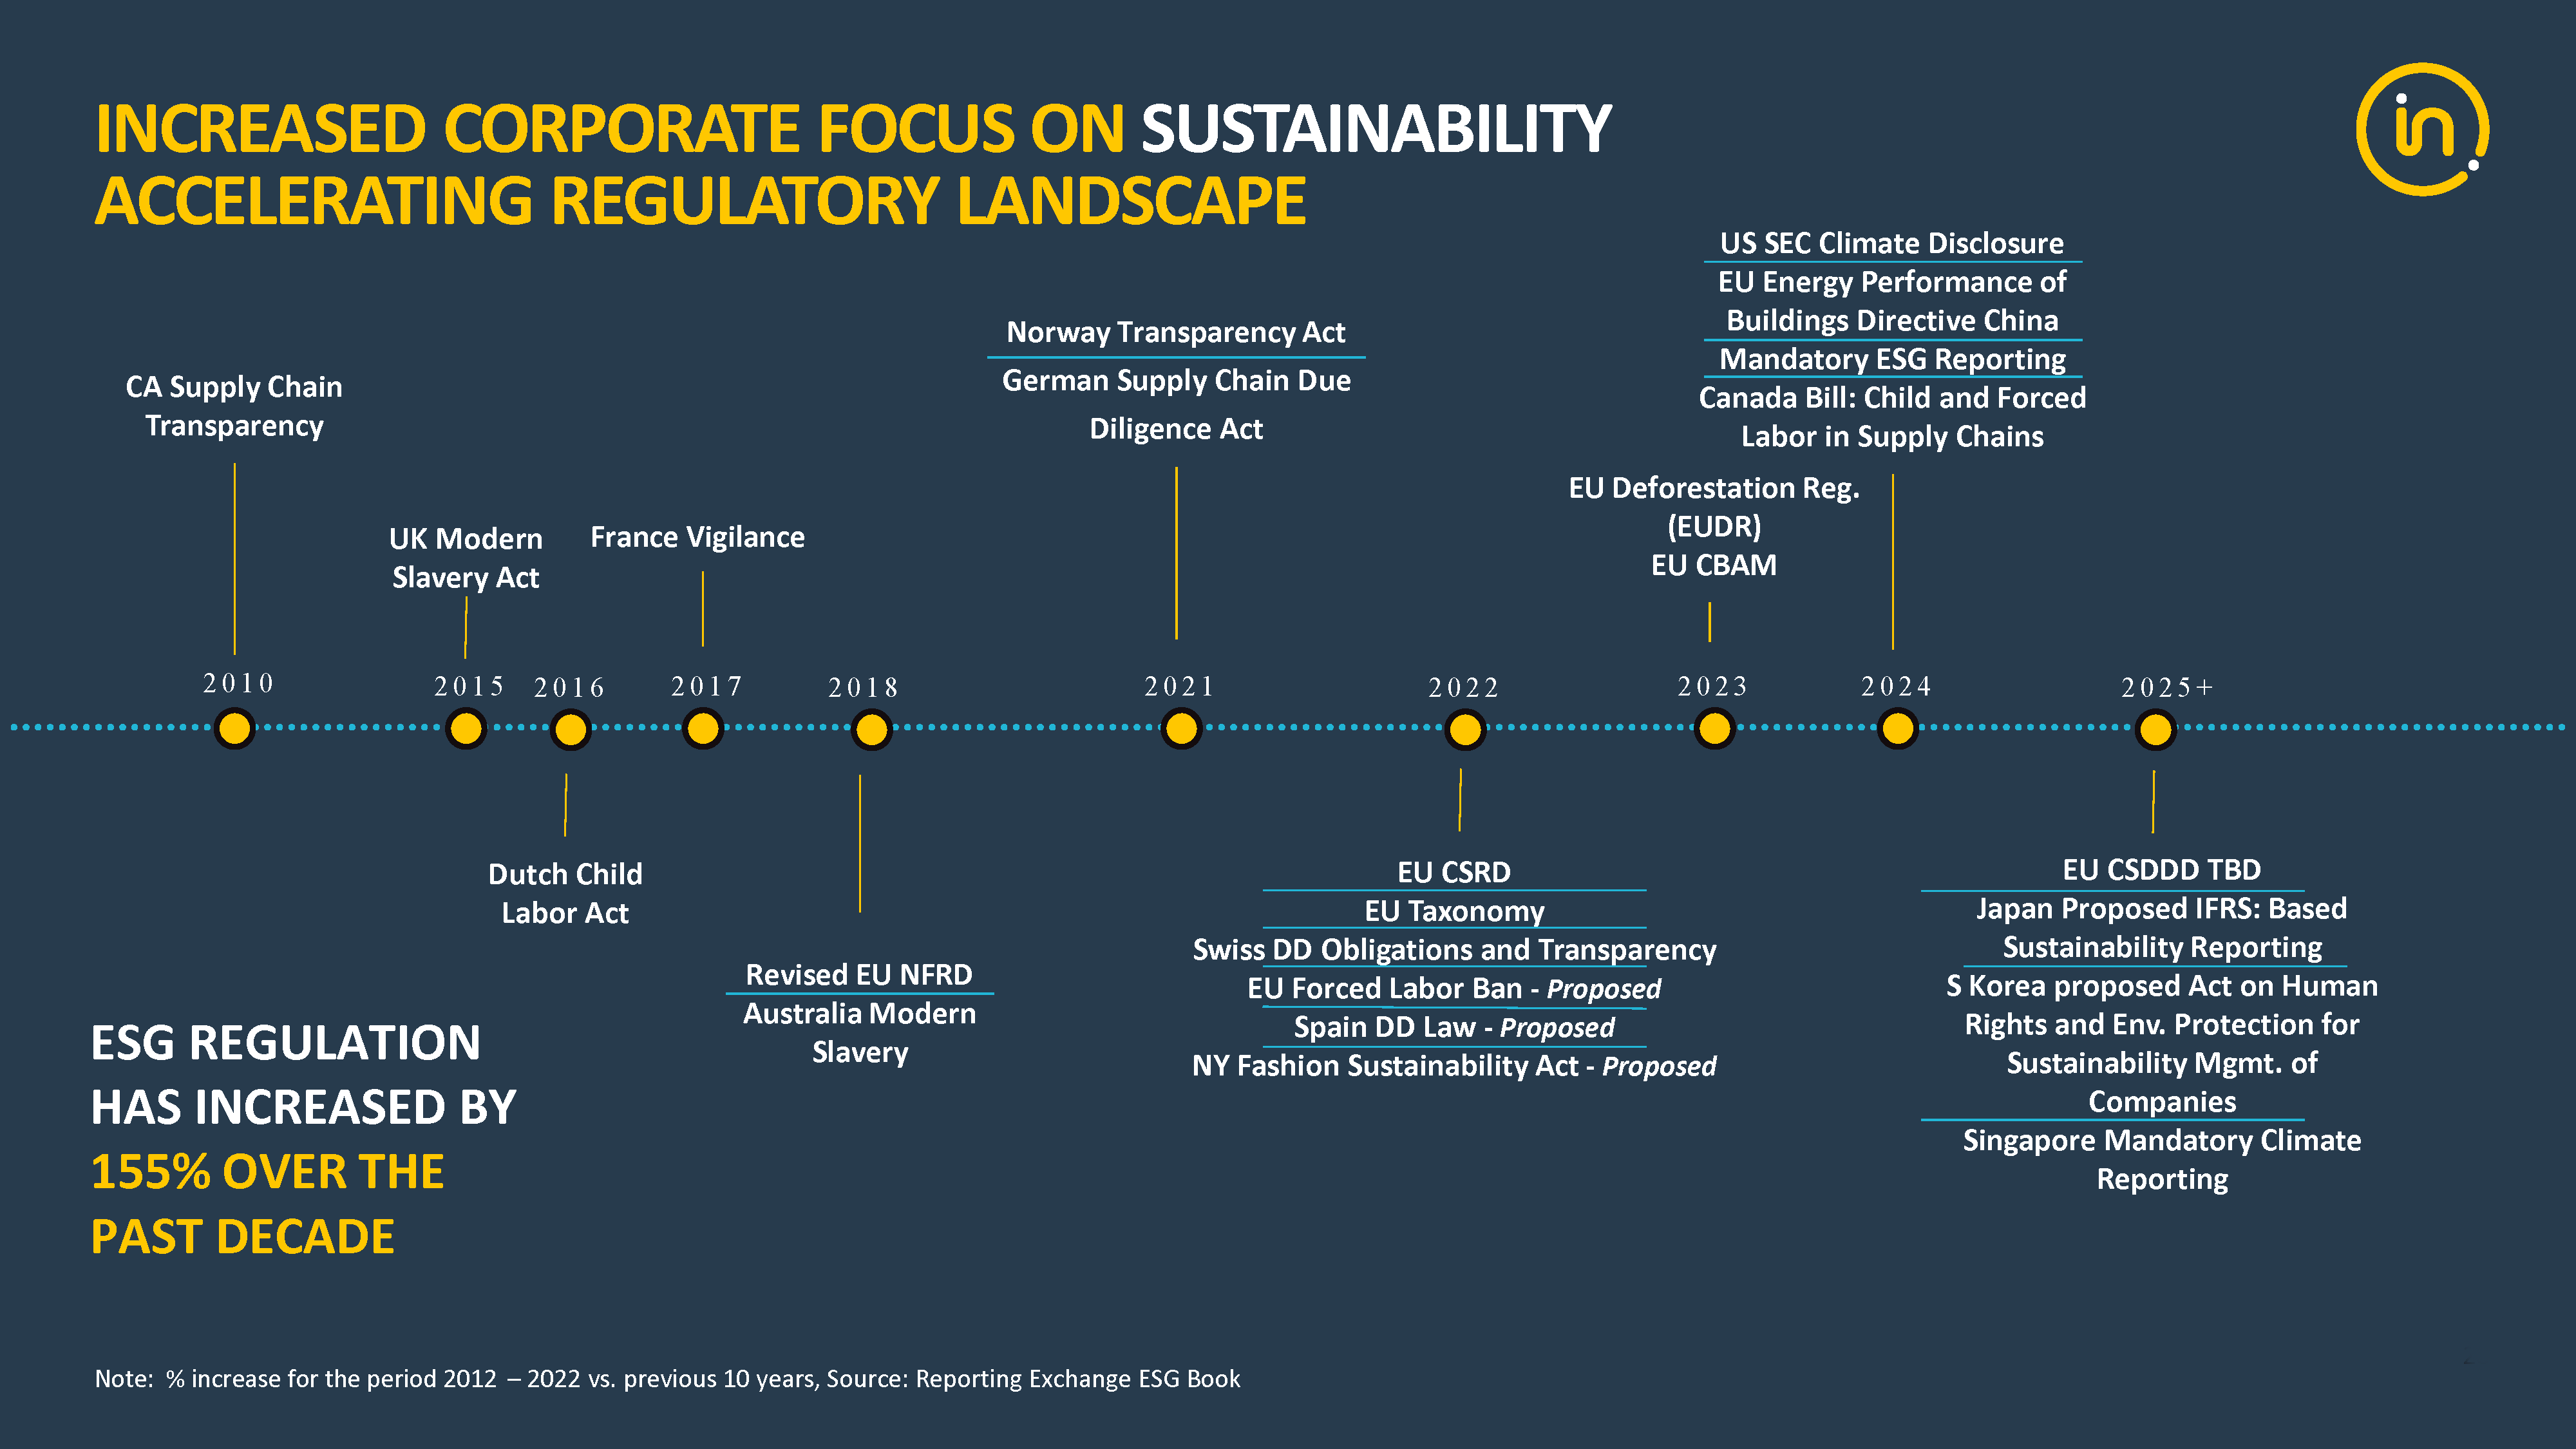
Sustainability regulations are constantly evolving with a greater number of companies facing mandatory abidance instead of opting in. This is a key driver for our business as the path to net zero has become a priority for many companies.

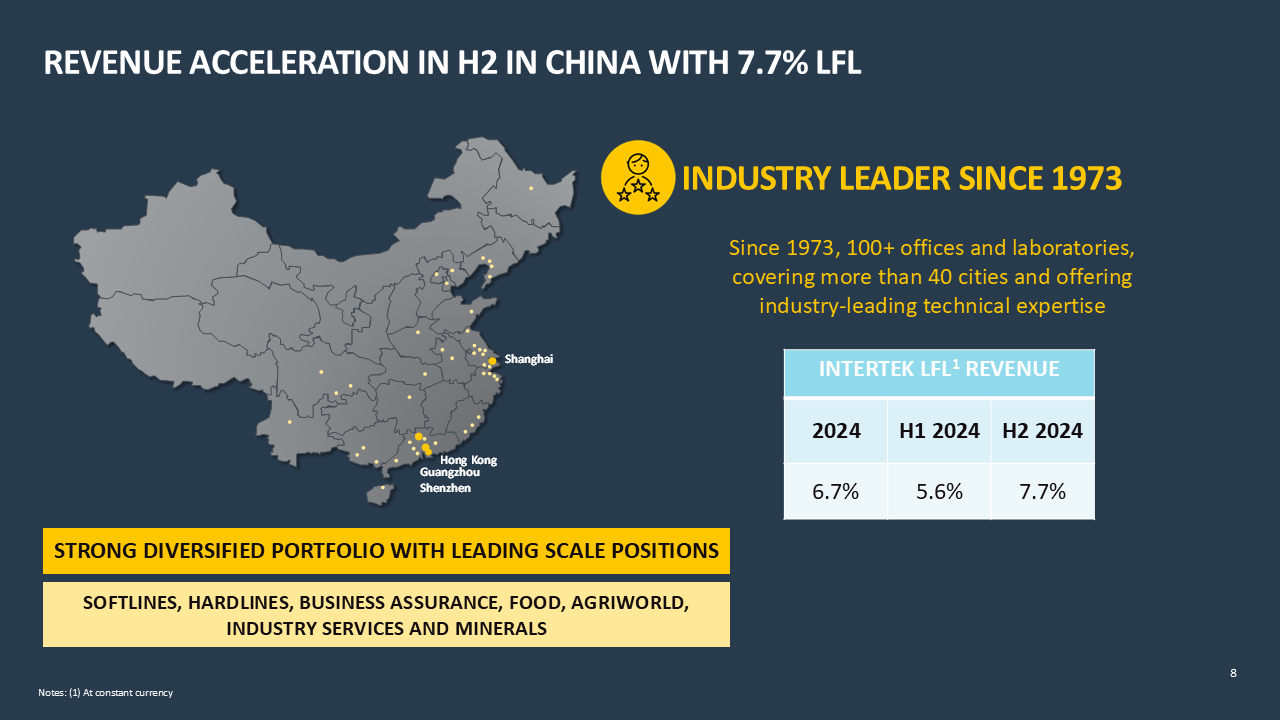
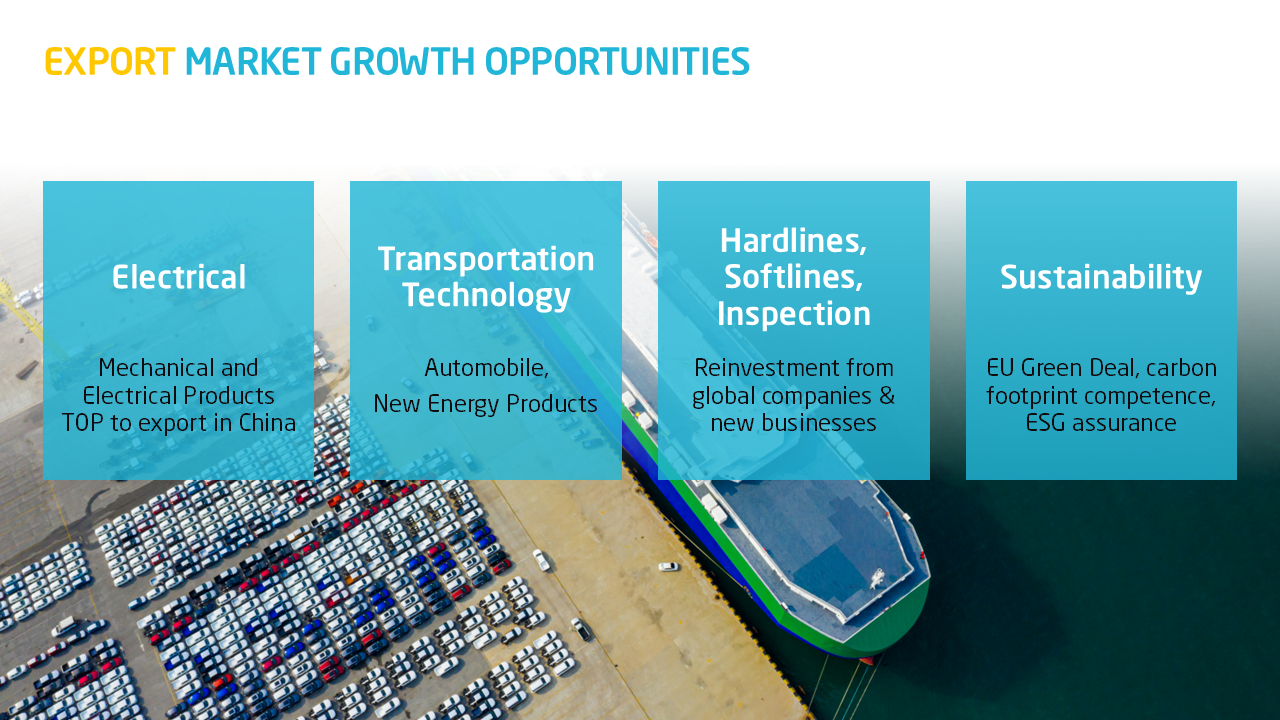
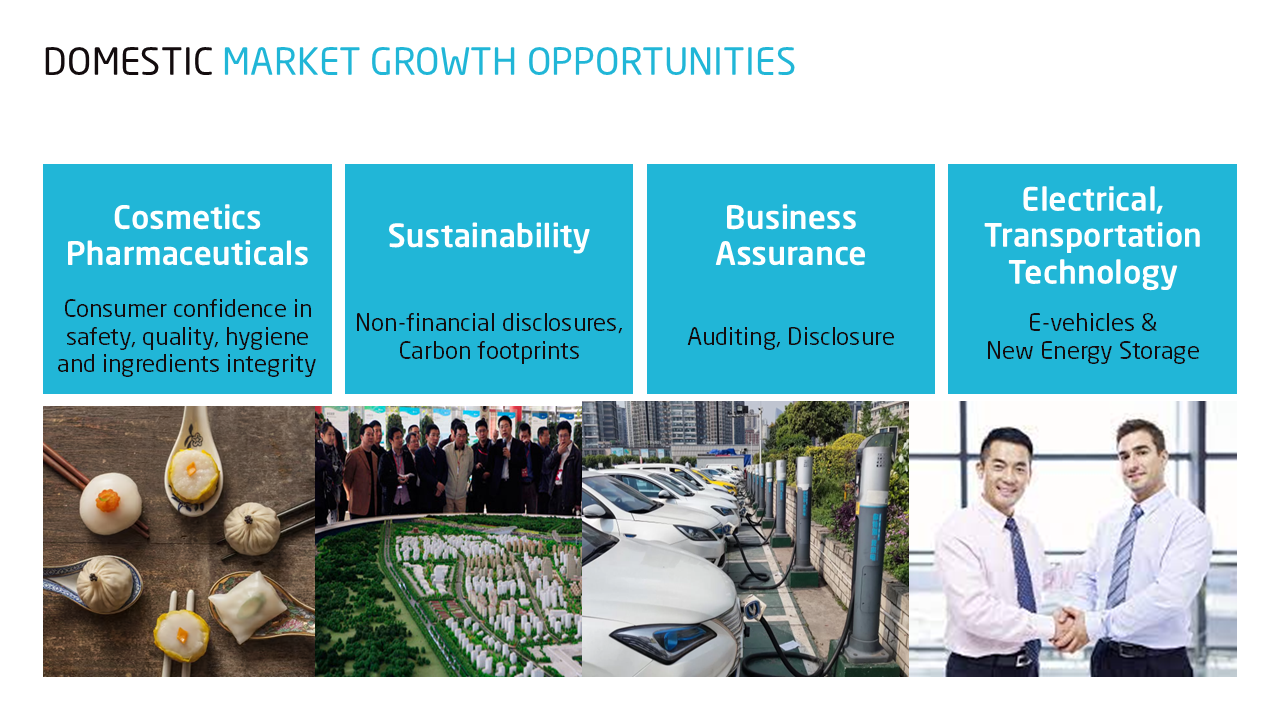
Our Chinese operations have experienced a robust performance with 6.7% lfl revenue growth in FY24. We have seen good growth, both in our export-driven activities (75% of revenues) and in our domestic-focused activities (25%).

China +1 not only allows companies to diversify their supply chain but will result in more SKU’s to be tested across various markets and to various standards, providing a growth opportunity for Intertek.
There remains ample opportunity in the Chinese export market ranging from automotive (ie. Electric Vehicles) to greater opportunity in the Consumer business and Sustainability metrics.
In addition to the export market, despite currently facing challenges, the domestic Chinese market has experienced significant growth over the last number of years. Growth opportunities in quality standards, ESG disclosures and supply chain assurance across many industries remain.
Cash Compounder Earnings Model
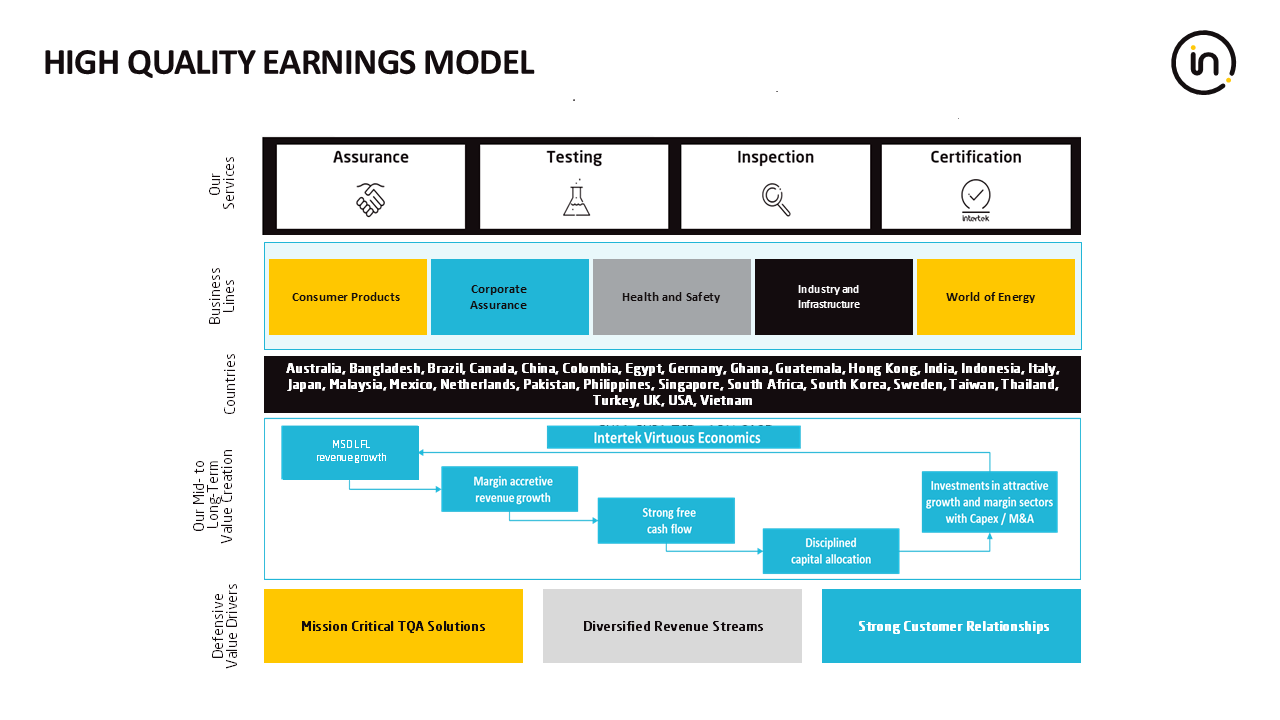
We operate a high-quality cash compounder earnings model, focusing on the compounding effect year after year of high-quality margin accretive revenue growth, strong free cash flow and superior returns. We aim to deliver significant value for every stakeholder.
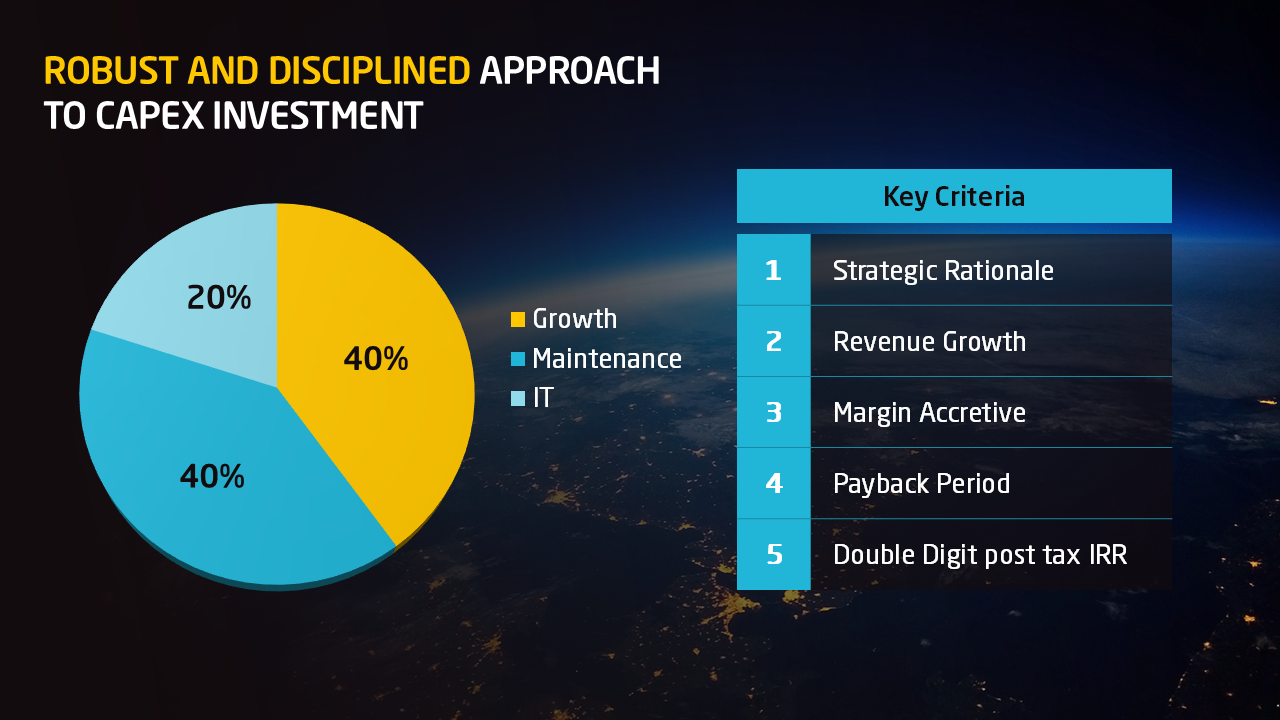
As part of our disciplined approach to capital allocation we view our CapEx investments through the lens of 5 key criteria. This includes our strategic rationale, potential revenue growth, the level of margin accretion, payback period and a double-digit post tax IRR.
We target a capex/sales ratio of up to 5%
In order to maintain a focus on productivity across the organisation, pricing is embedded down to a site level with the aim to maximise efficiency. With regard to the pass-through of inflation, 50% of the increase is passed on, this further embeds our view on generating value for Intertek and its clients rather than the ease of higher prices.
Many actions have been taken to improve cash conversion as laid out in our AAA growth strategy. A greater focus has been put on working capital discipline and thorough forecasting of cash. In addition, we perform frequent reviews of our performance versus targets.
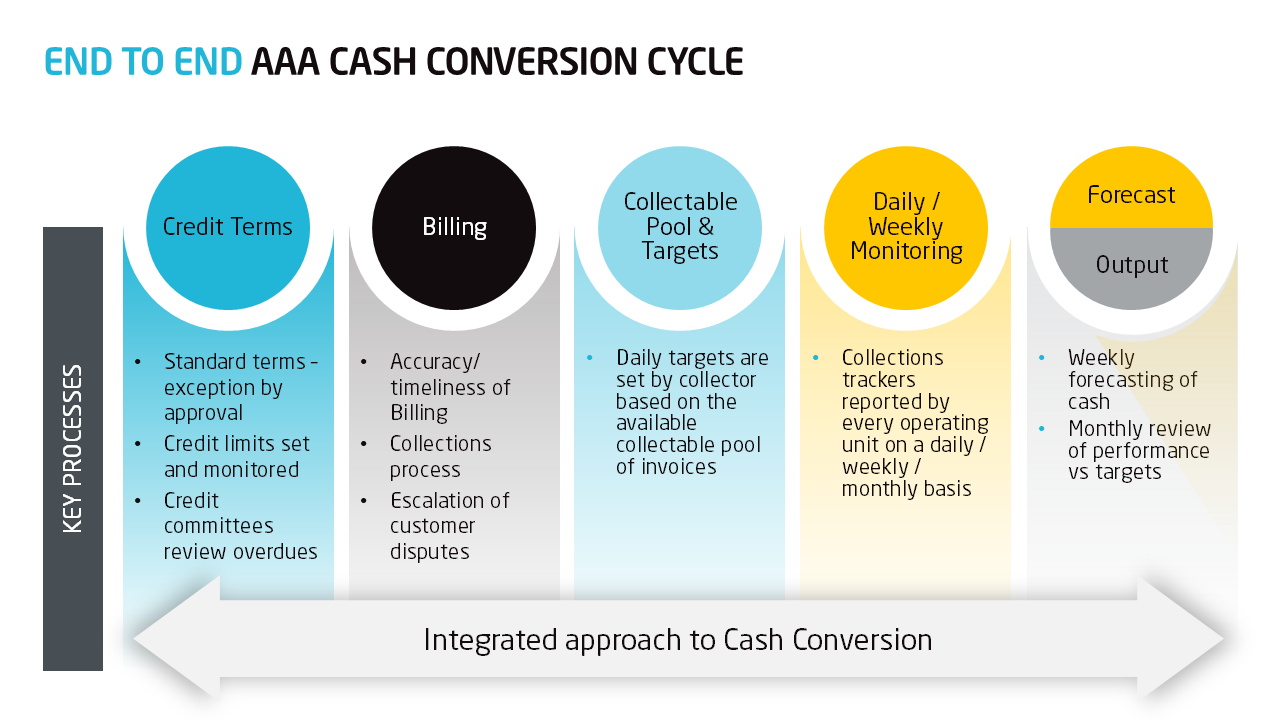
Intertek has a track record of strong cash performance.
In 2025, our cash conversion of 110% was excellent providing us with the funds to invest £300m in growth and return £602m to our shareholders.
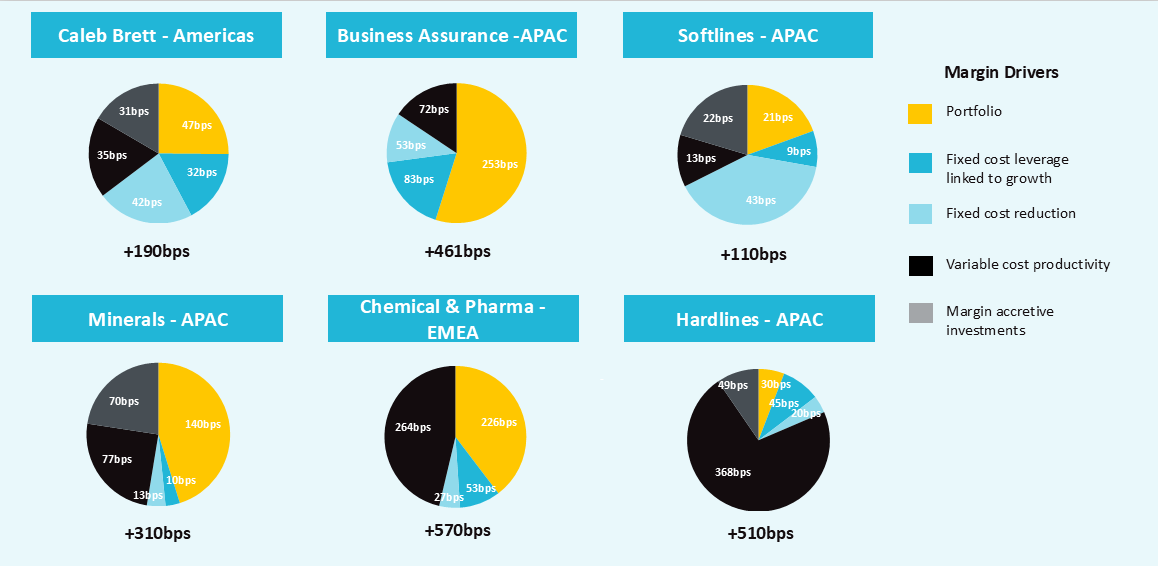
Margin Progression
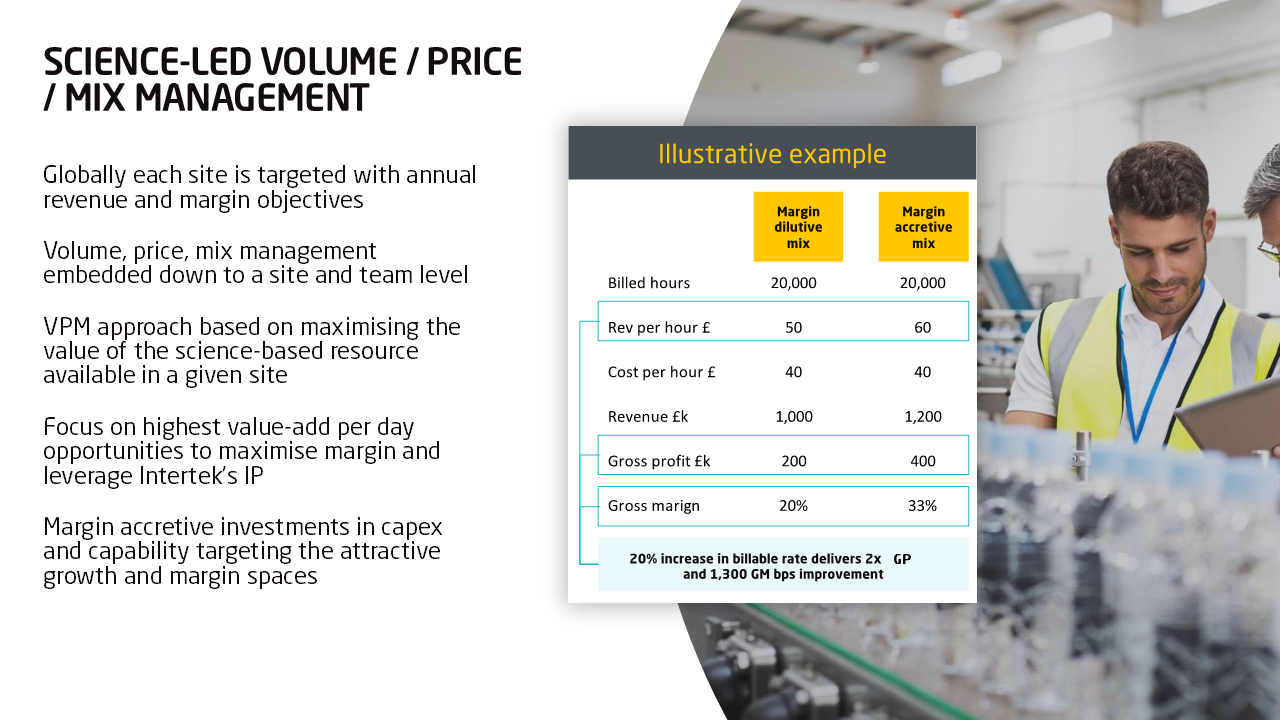
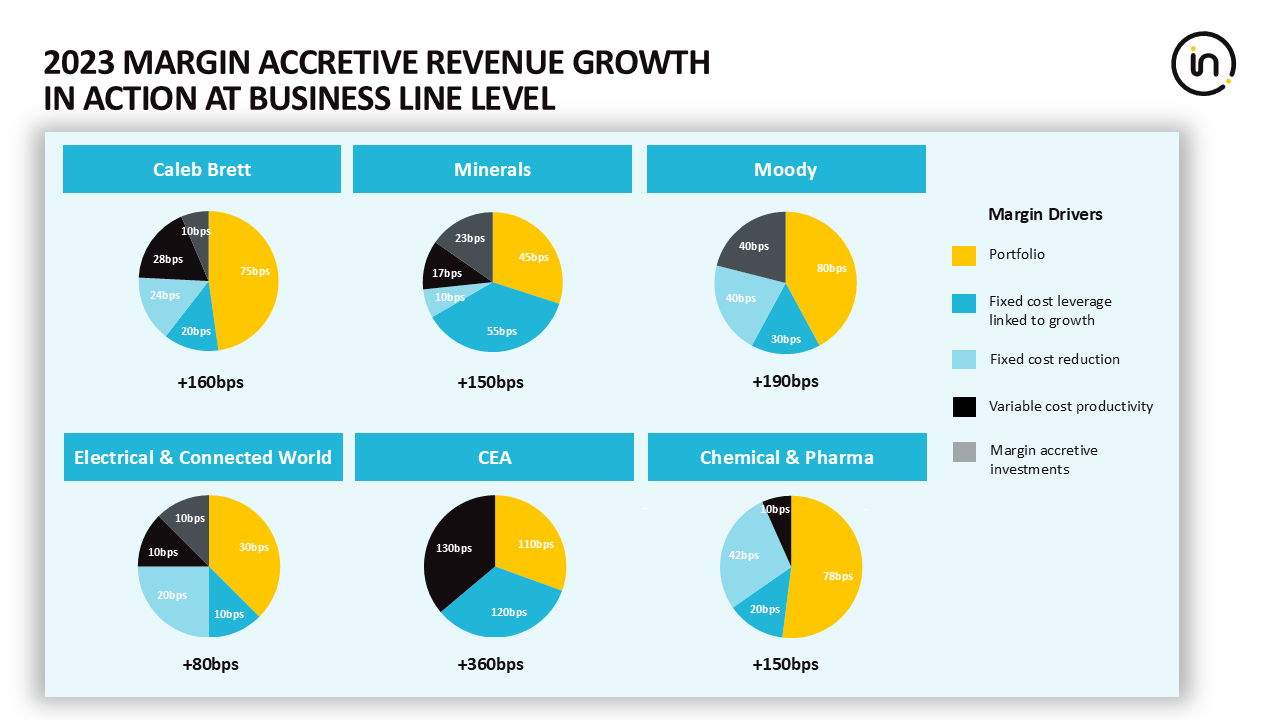
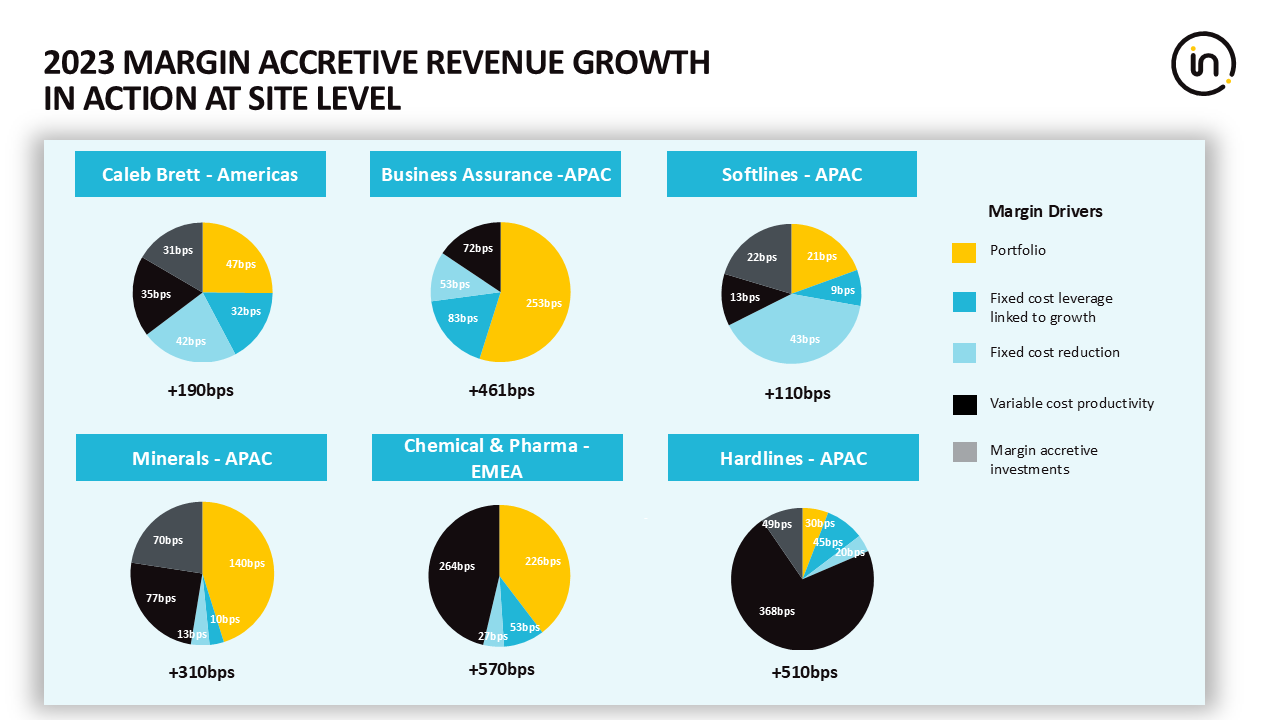
Margin accretive revenue growth is central to the way we manage performance at Intertek.
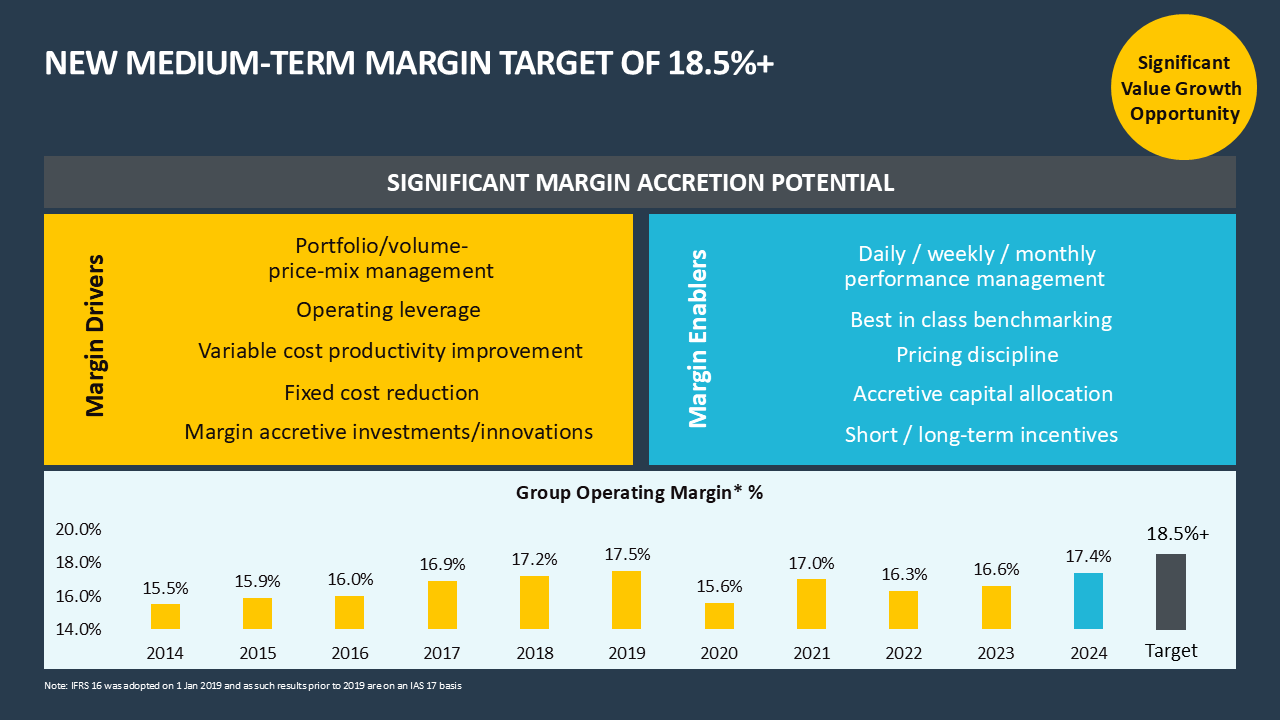
Between 2015 and 2025, we have step changed our margin performance, having increased our reported margins by 220bps.
- We have benefitted from our portfolio mix and strong pricing power.
- We delivered consistent revenue growth, with good operating leverage.
- We have reduced our fixed costs both at the operating and management levels.
- We have re-invented our processes to increase our productivity.
- Our capex and M&A investments were made in high growth and high margin sectors.
The margin accretion potential ahead is significant, and we are on track to deliver our 18.5%+ margin target.
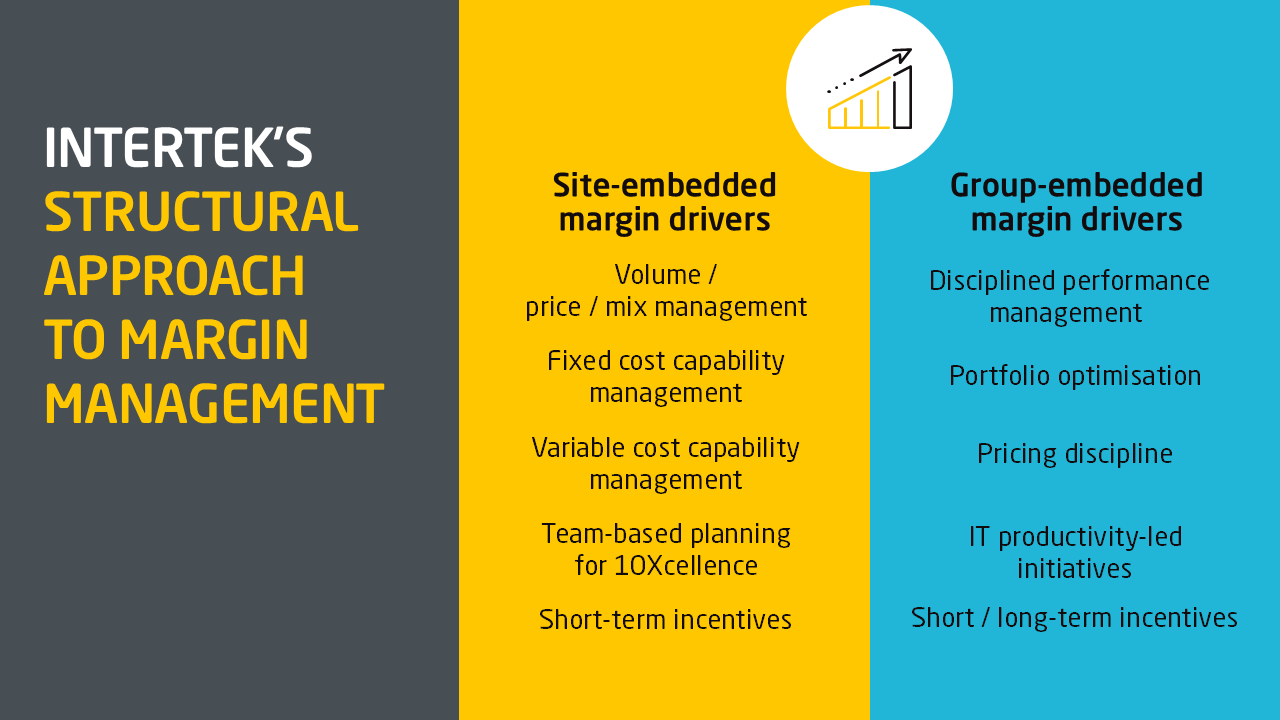
Structural margin improvement is driven from both a site and management level. This includes a rigorous focus on productivity metrics, cost and price discipline and portfolio management.
In achieving margin progression, the elements playing a pivotal role are operating leverage, cost discipline and margin accretive investments.
Please note that the below slides are extracted from our FY 23 presentation and may not be fully up to date.
As outlined in our CMD in 2023, our focus is on investing in high growth margin accretive areas be that organically or through acquisition. Over the last decade, we have made high-growth, margin accretive acquisitions that augment the Intertek offering. Of note, since 2015, Assurance revenues have increased at a CAGR of 13%.
Examples of these investments include Alchemy, SAI Global, CEA, PlayerLync and the acquisitions of TESIS and Envirolab in 2025.
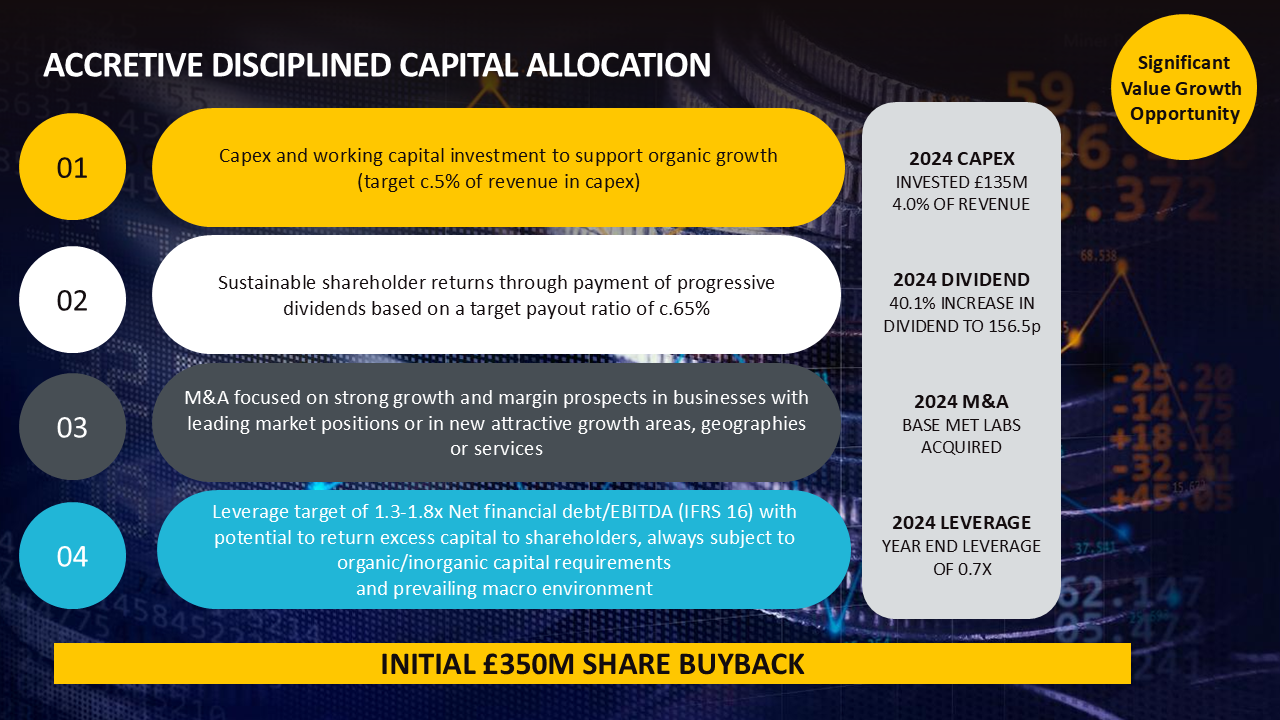
Capital Allocation
We take a disciplined approach to capital allocation. Our aim is to achieve margin accretive revenue growth and strong free cash flow. As such our CapEx investments are viewed through that lens.
As part of our M&A sourcing process, we use a funnel approach to narrow down potential options. The local nature of our business enables deals to be identified at a regional/site level that aligns with our overall strategy.
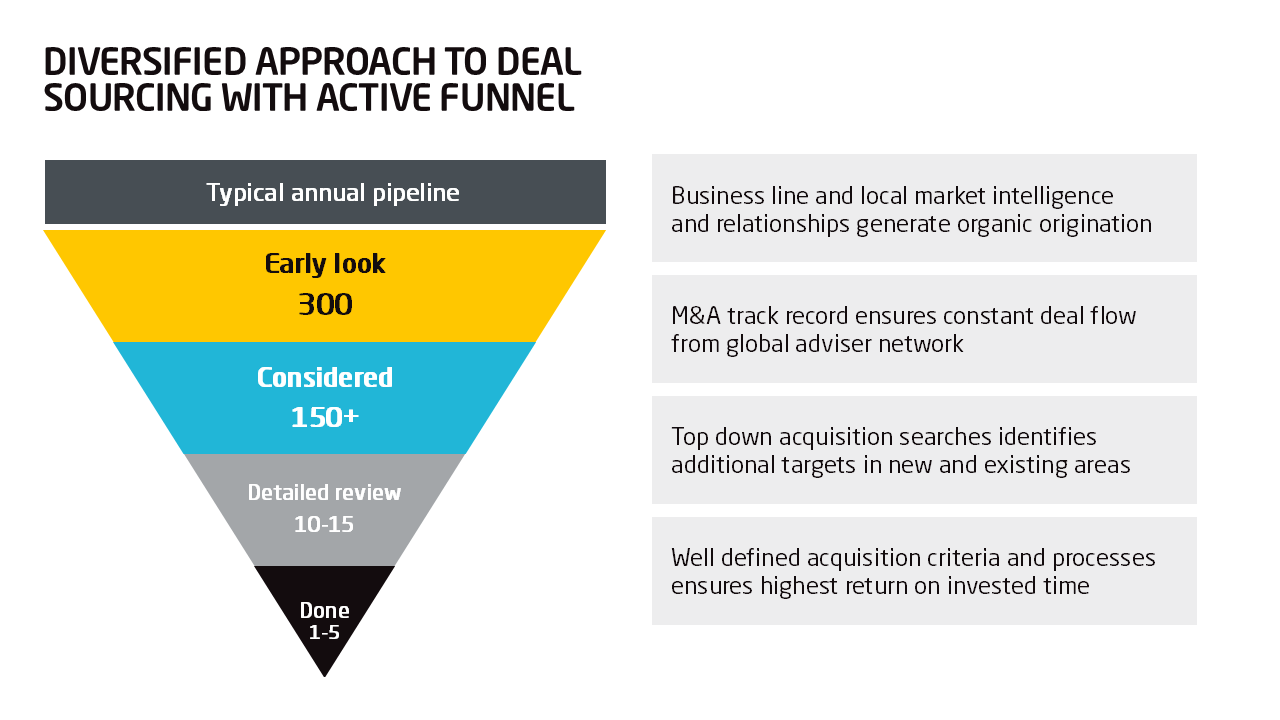
Our investments have historically spanned across many regions and we constantly scan for new opportunities, be that organically or inorganically. We look for opportunities in high growth areas that will provide scale and augment the value Intertek currently offers.
Please note that the below slides are extracted from our HY 24 presentation and may not be fully up to date.

Our target financial leverage range is 1.3x –1.8x with the optionality to return excess capital when it cannot be deployed at attractive returns. At 31 December 2025, our leverage was 1.3x net debt/EBITDA.
We maintain a continued focus on capital allocation. As such, given the strength of our earnings models, our performance track record, our confidence in future growth opportunities and the current level of leverage, at the time of our FY24 results, we announced an initial £350 million share buyback program to be completed during 2025.
In our FY25 RNS we confirmed that our £350m share buyback programme was complete.
More information can be viewed in the most recent RNS here.
Innovations & Digitisation Opportunities
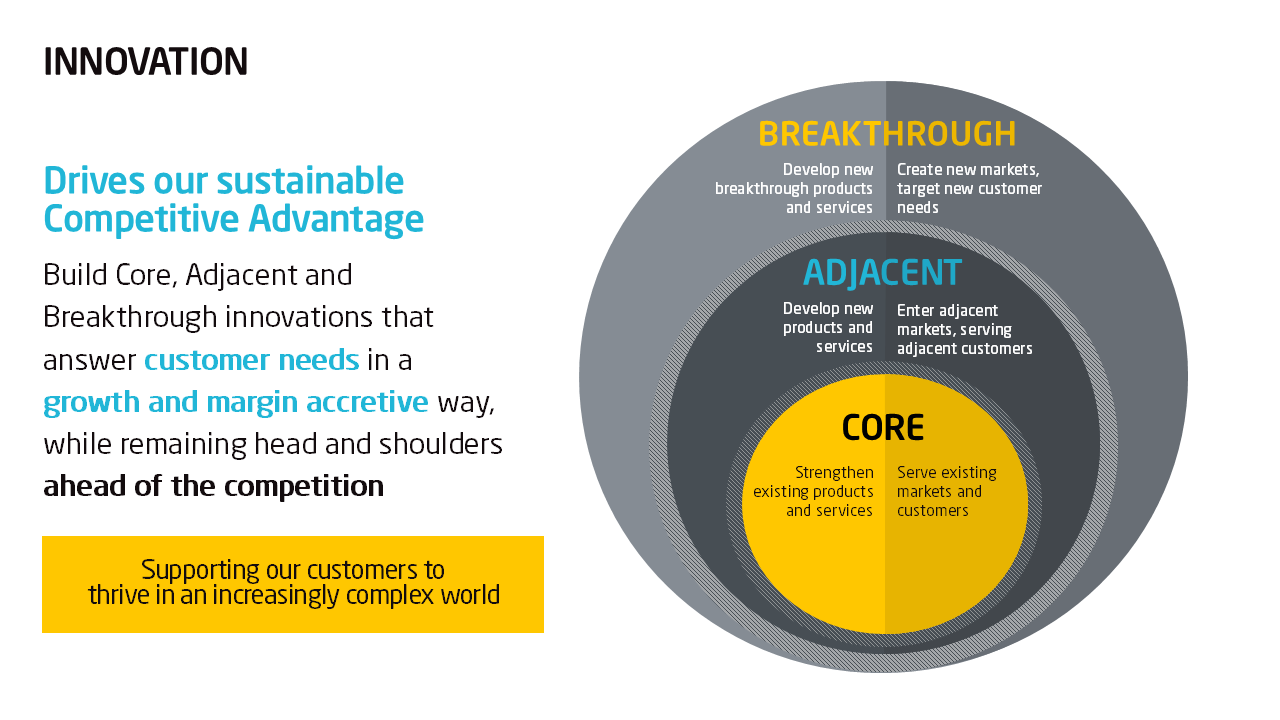
Our innovation strategy is focused on three dimensions; Core, Adjacent and Breakthrough innovations that not only answer customers’ current needs, but develop new products and services, creating new markets.
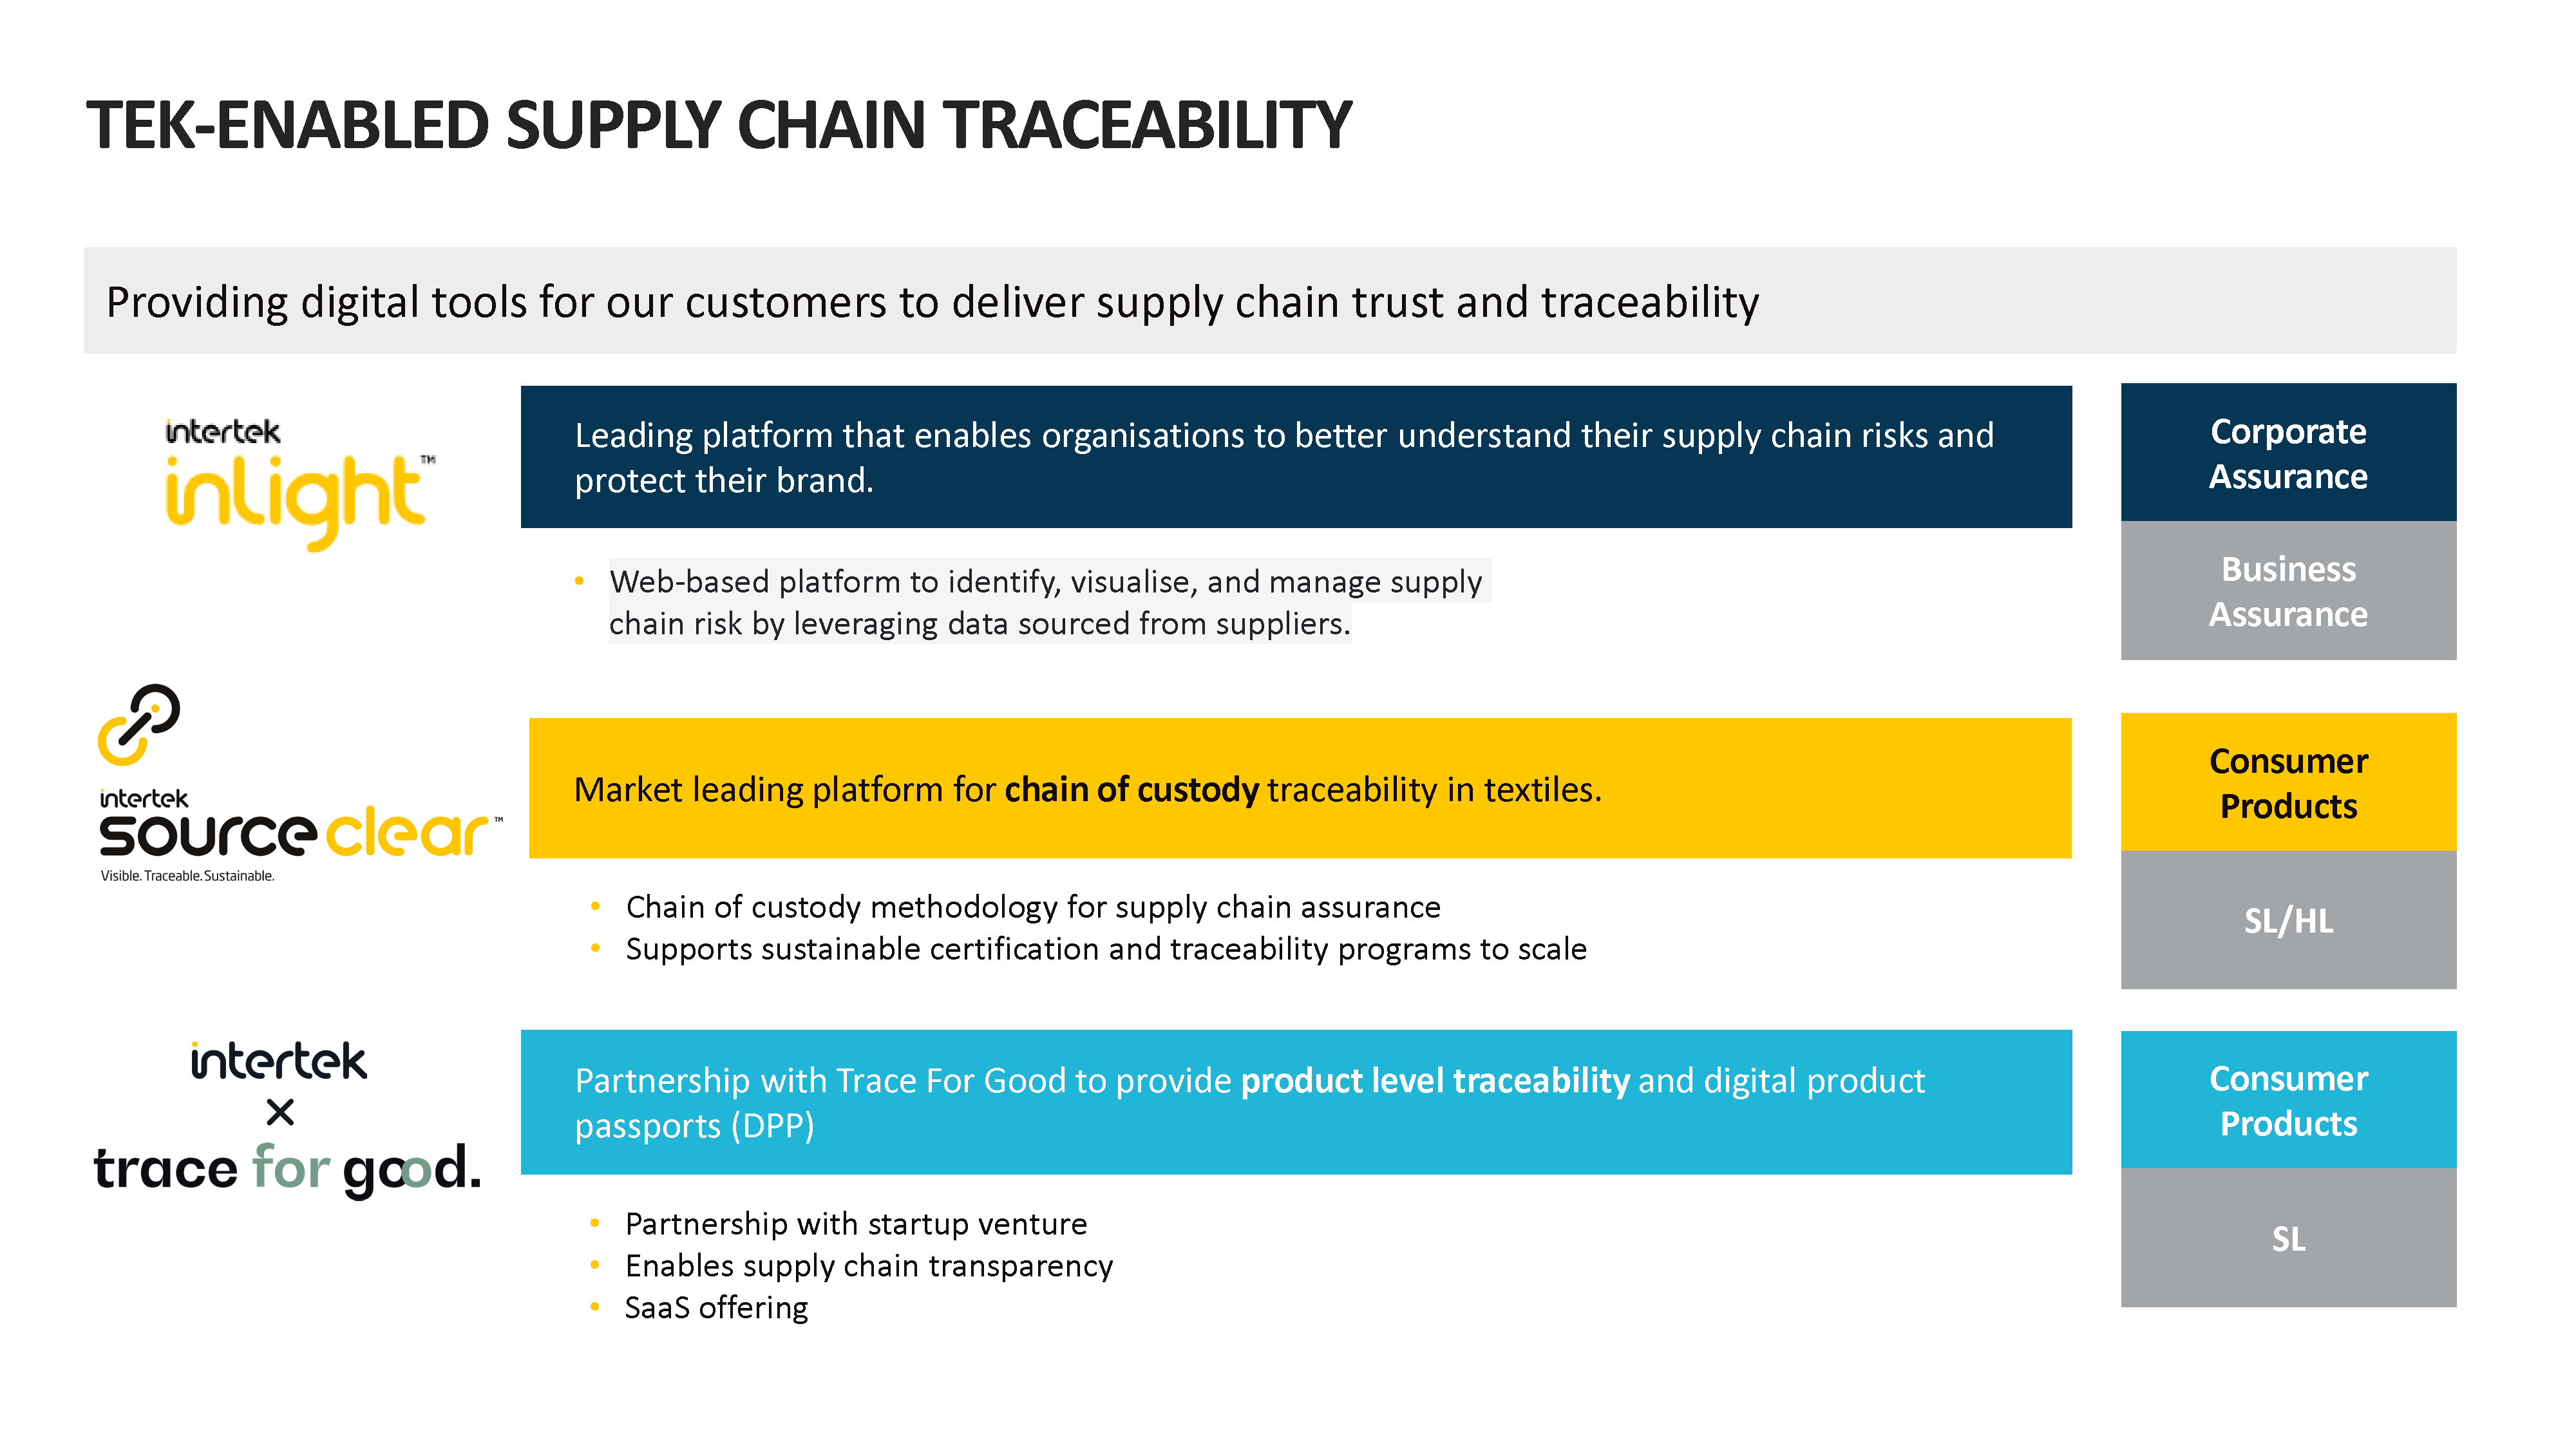
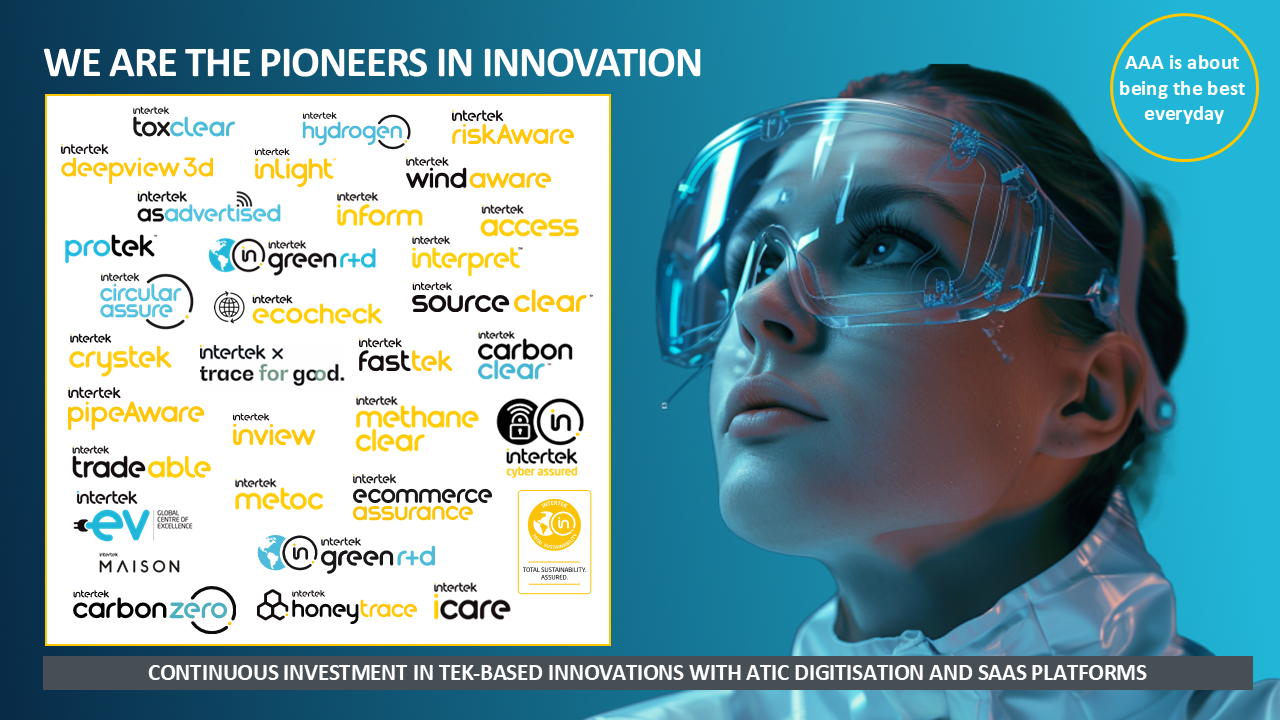
Intertek has created a number of successful breakthrough innovations over the years. The most recent example of this is AI², a comprehensive, risk-based AI assurance programme built around industry-leading solutions and addressing governance, transparency, security, and safety. Another example is Intertek ToxClear, a digital sustainable chemical management platform that helps firms with the traceability of chemicals throughout their supply chains.
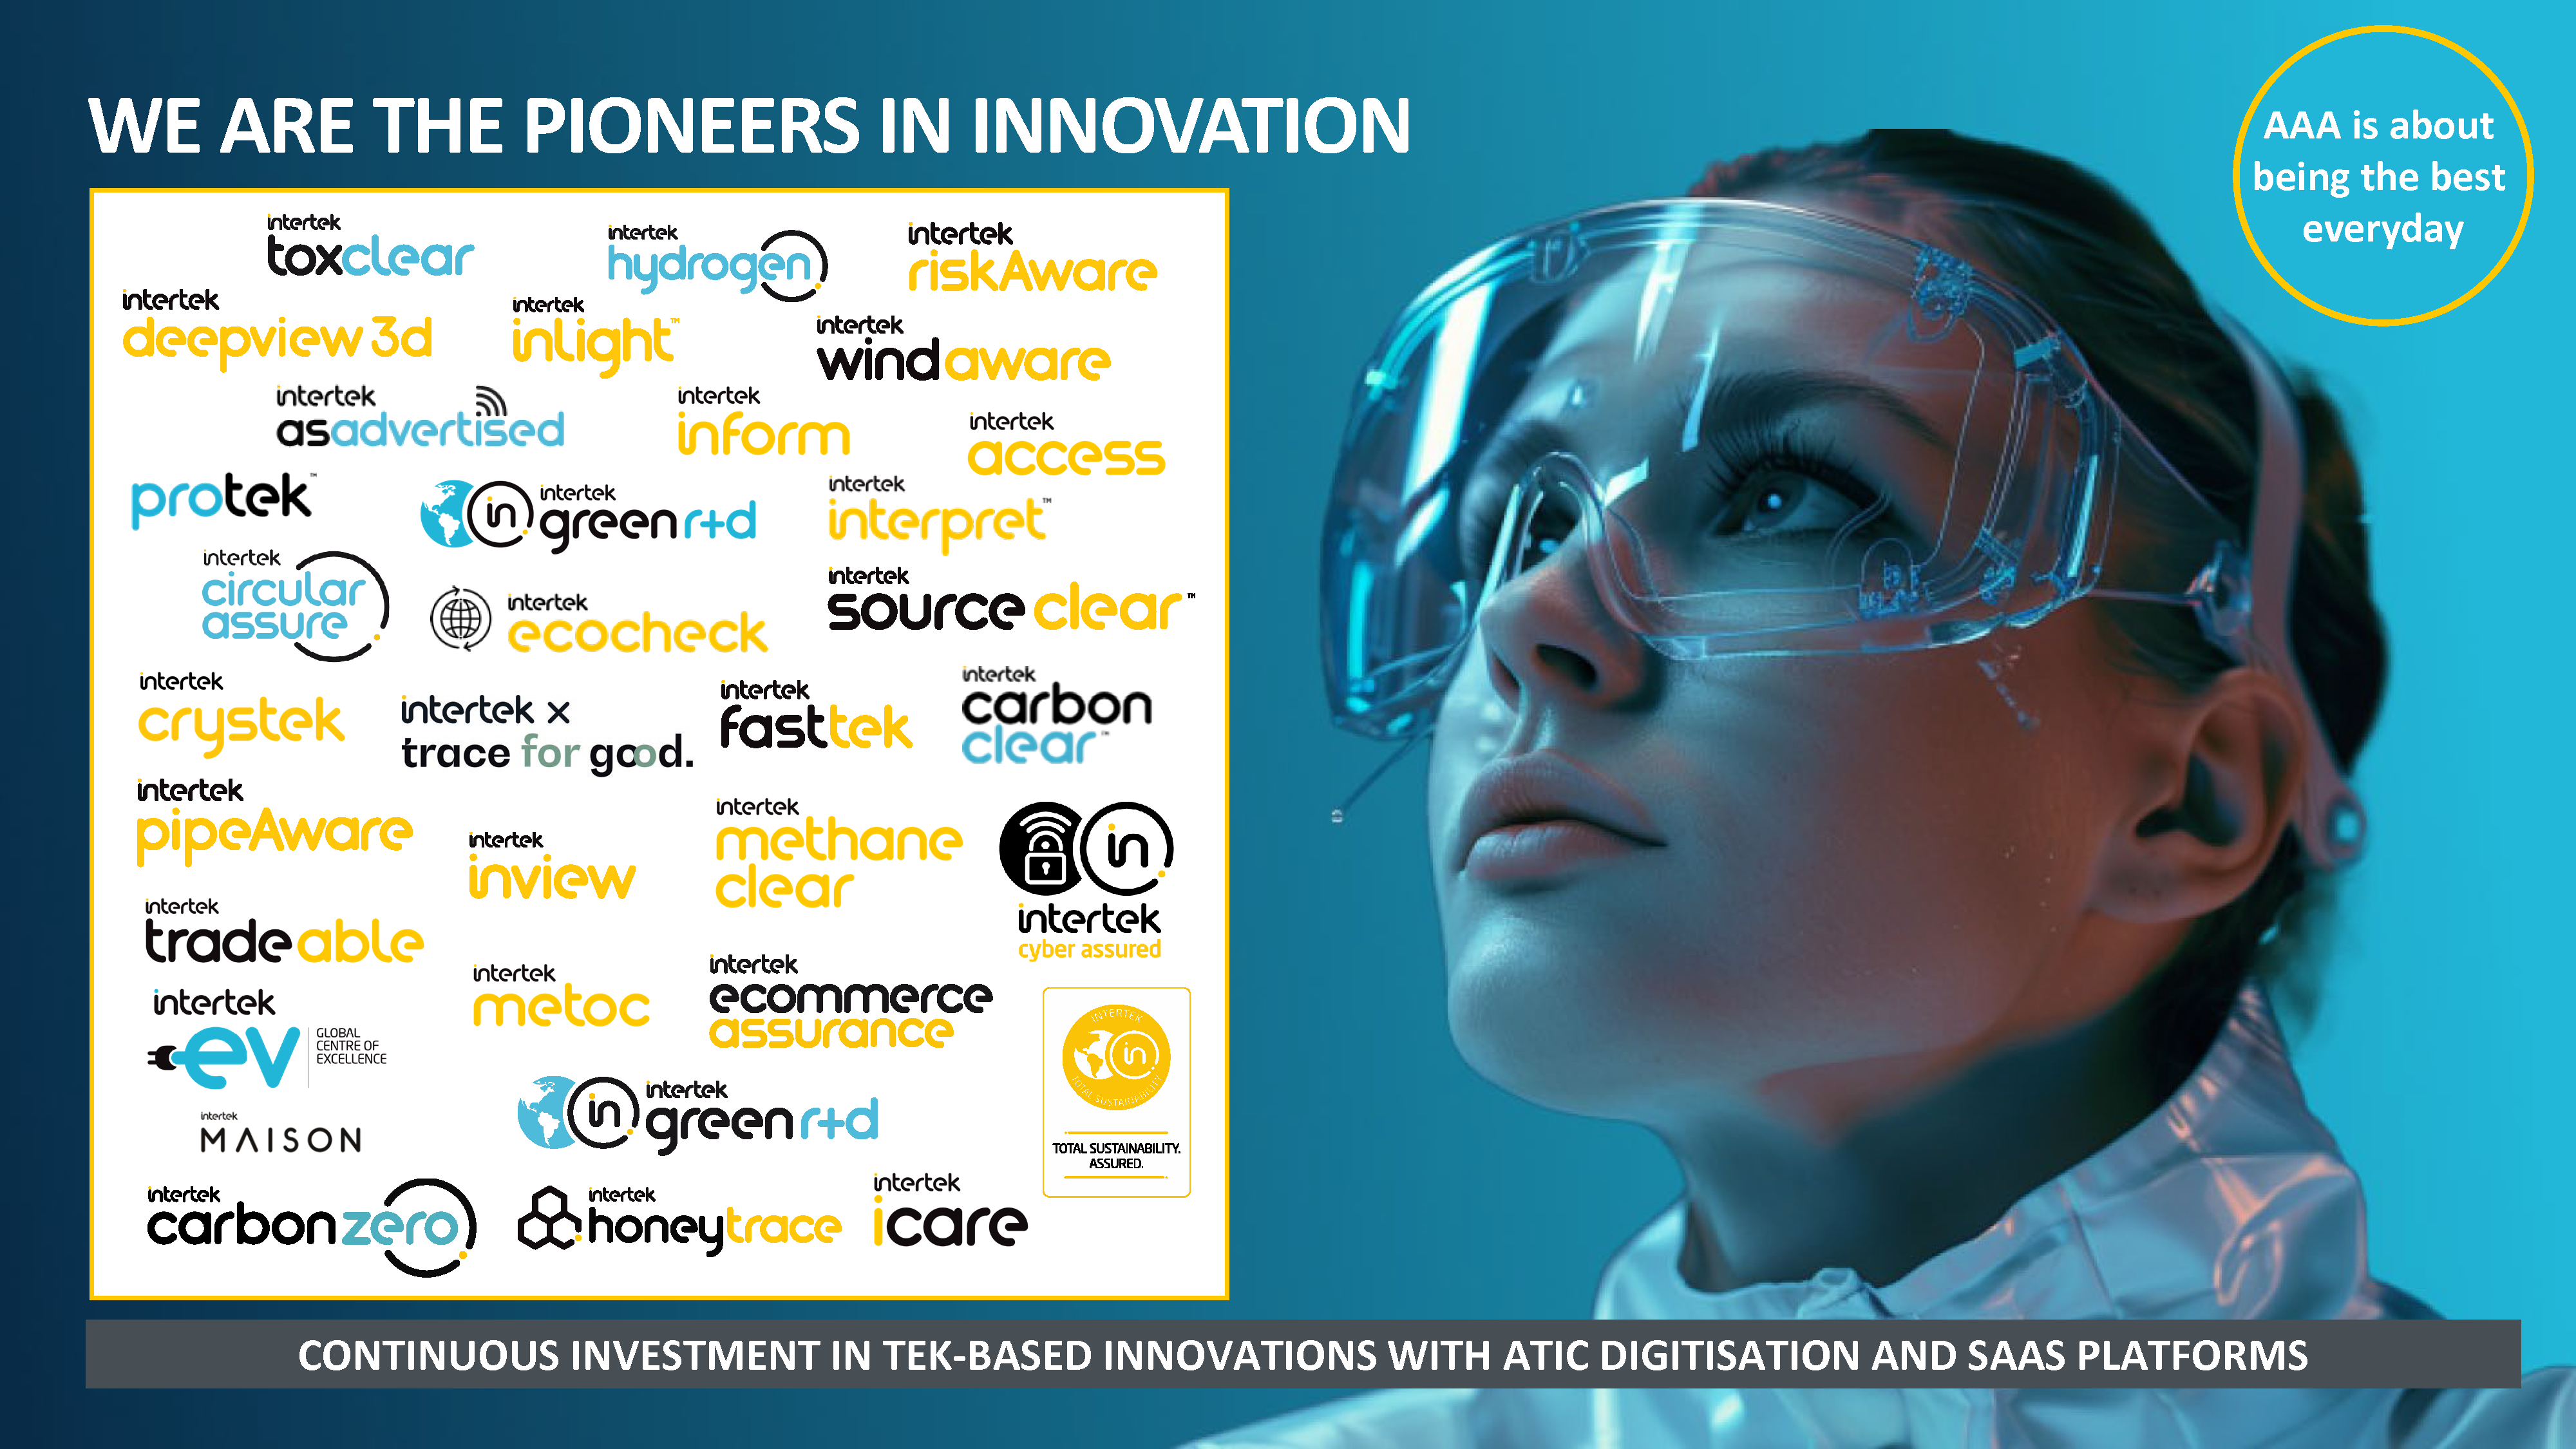
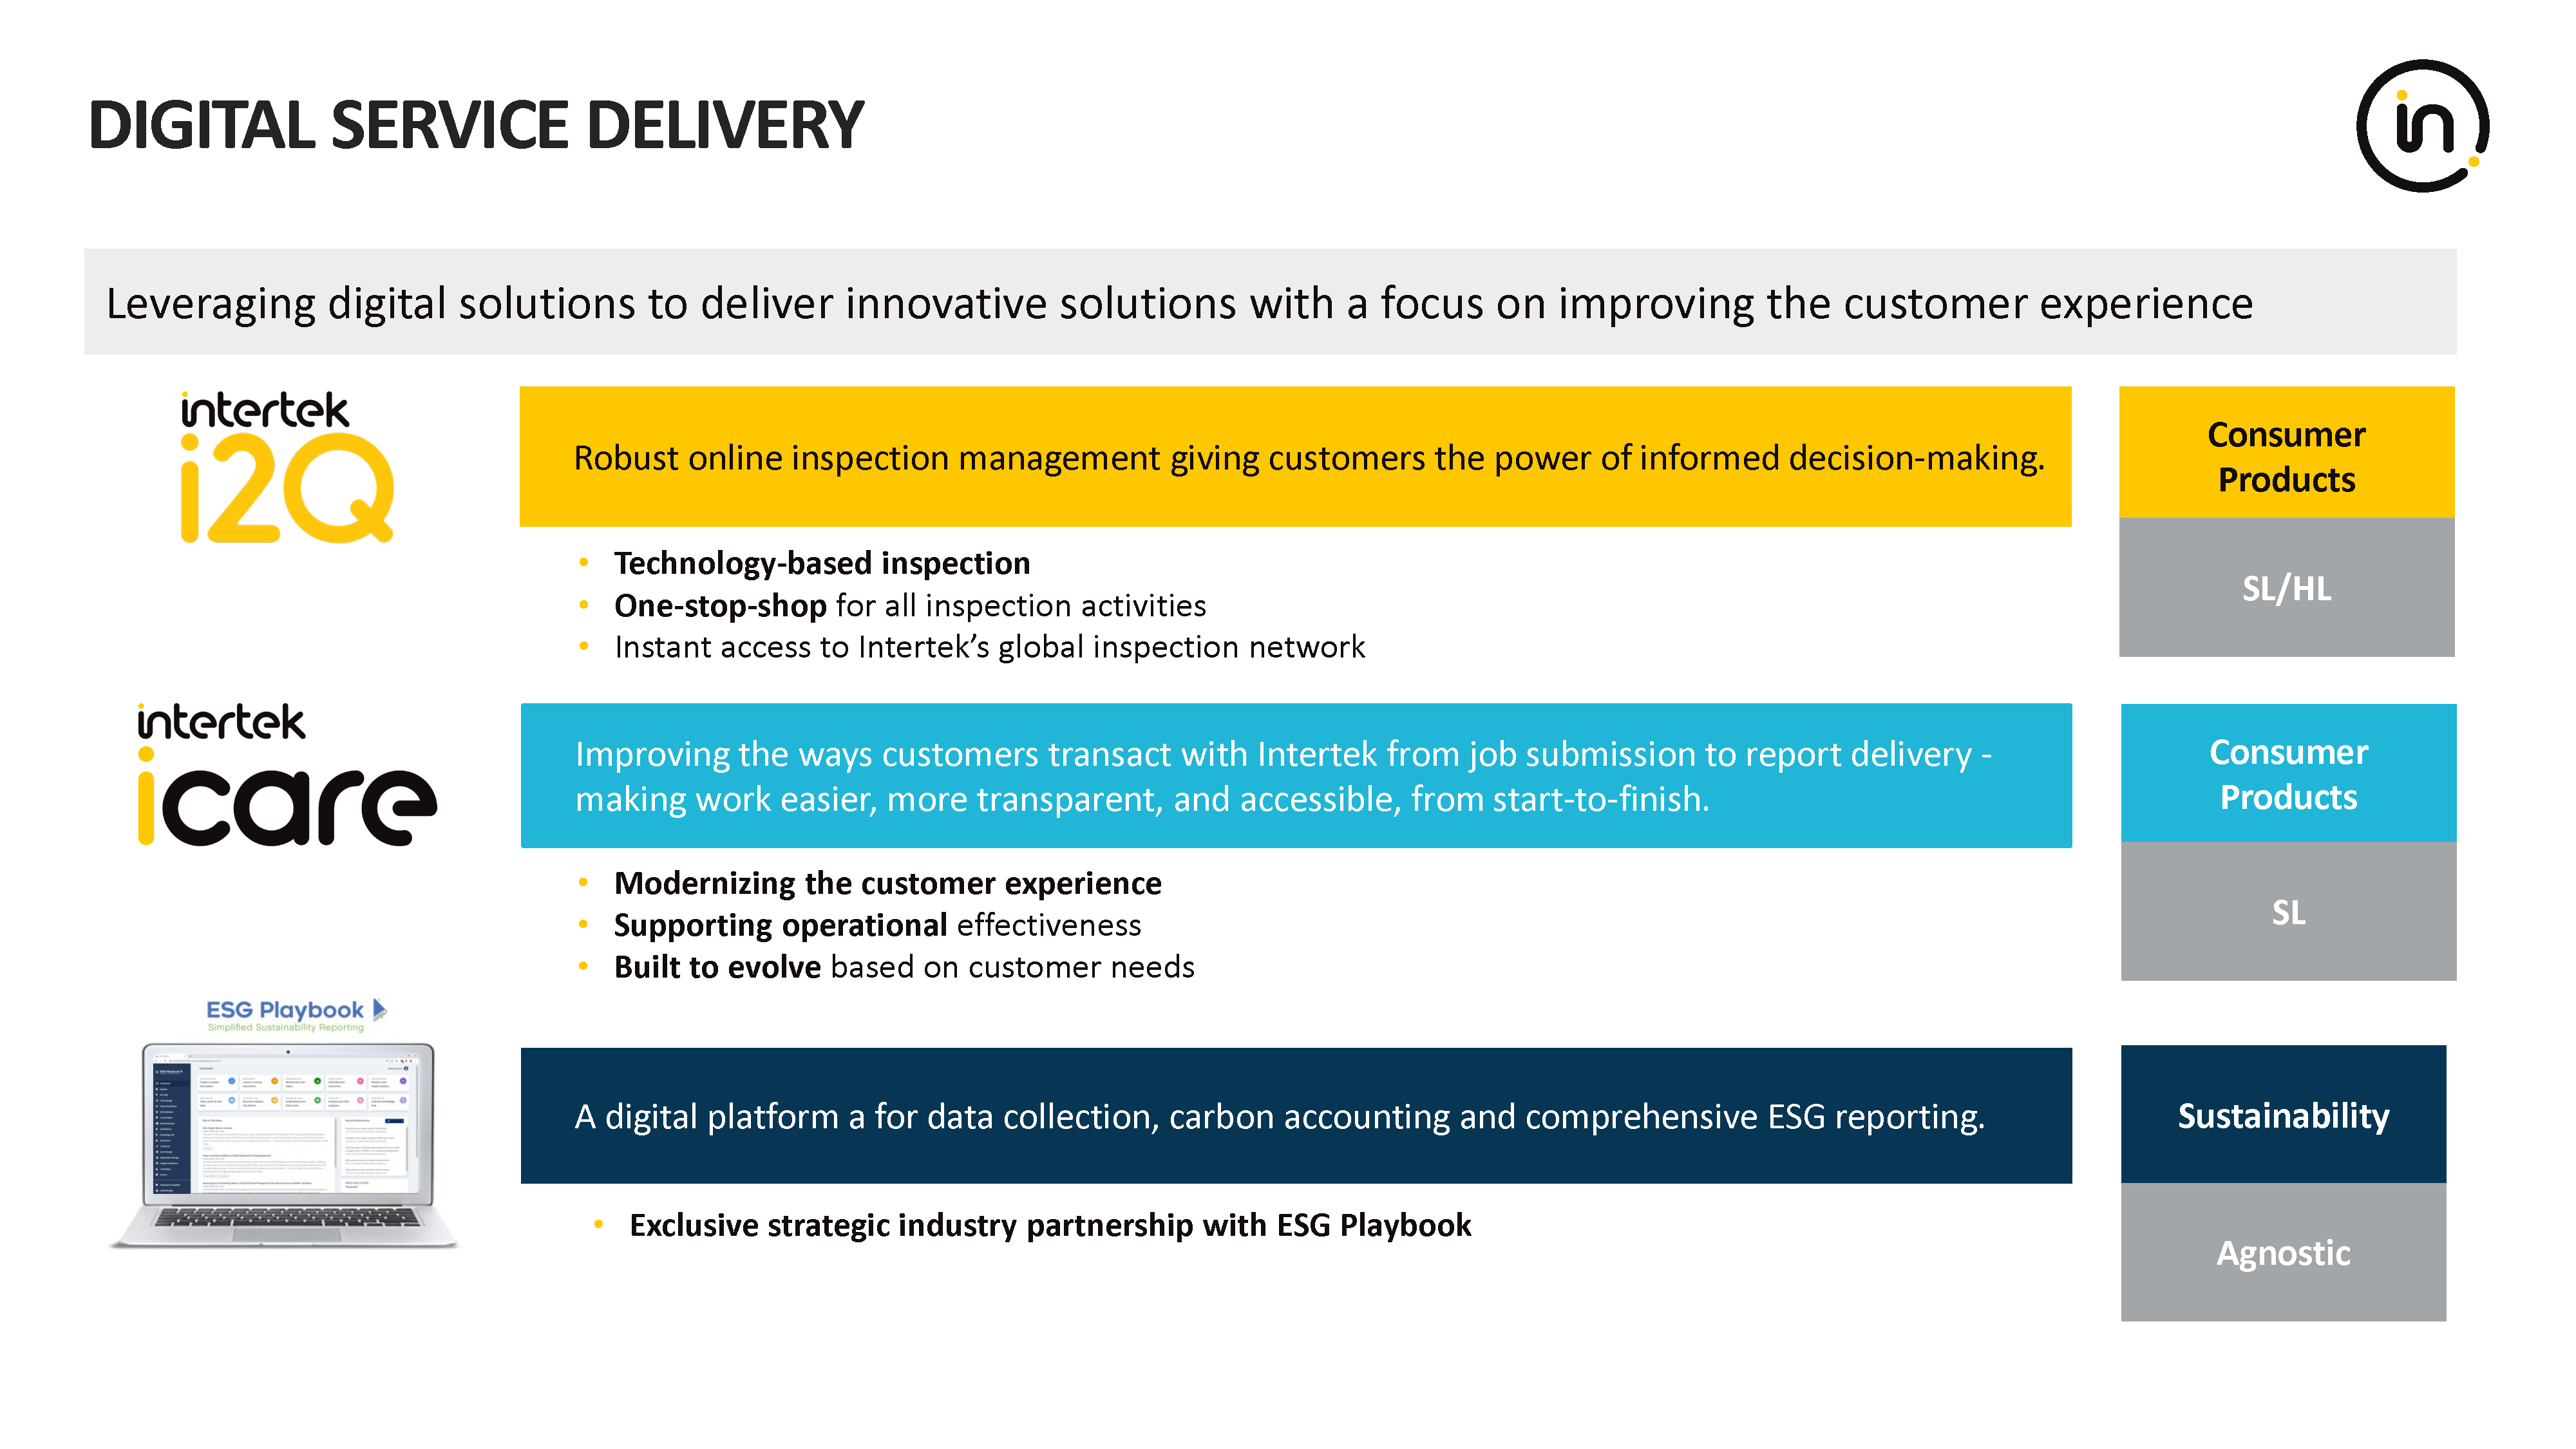
While the ATIC industry in its nature is quite labour intensive, Intertek has been leveraging digital solutions for some time to improve the service provided to customers. In addition to many technology-based solutions including the aforementioned innovations (SupplyTek and AI²), technology-based inspection is a tool provided by Intertek which customers can use to make informed decisions. This can be accessed in real-time via the platform
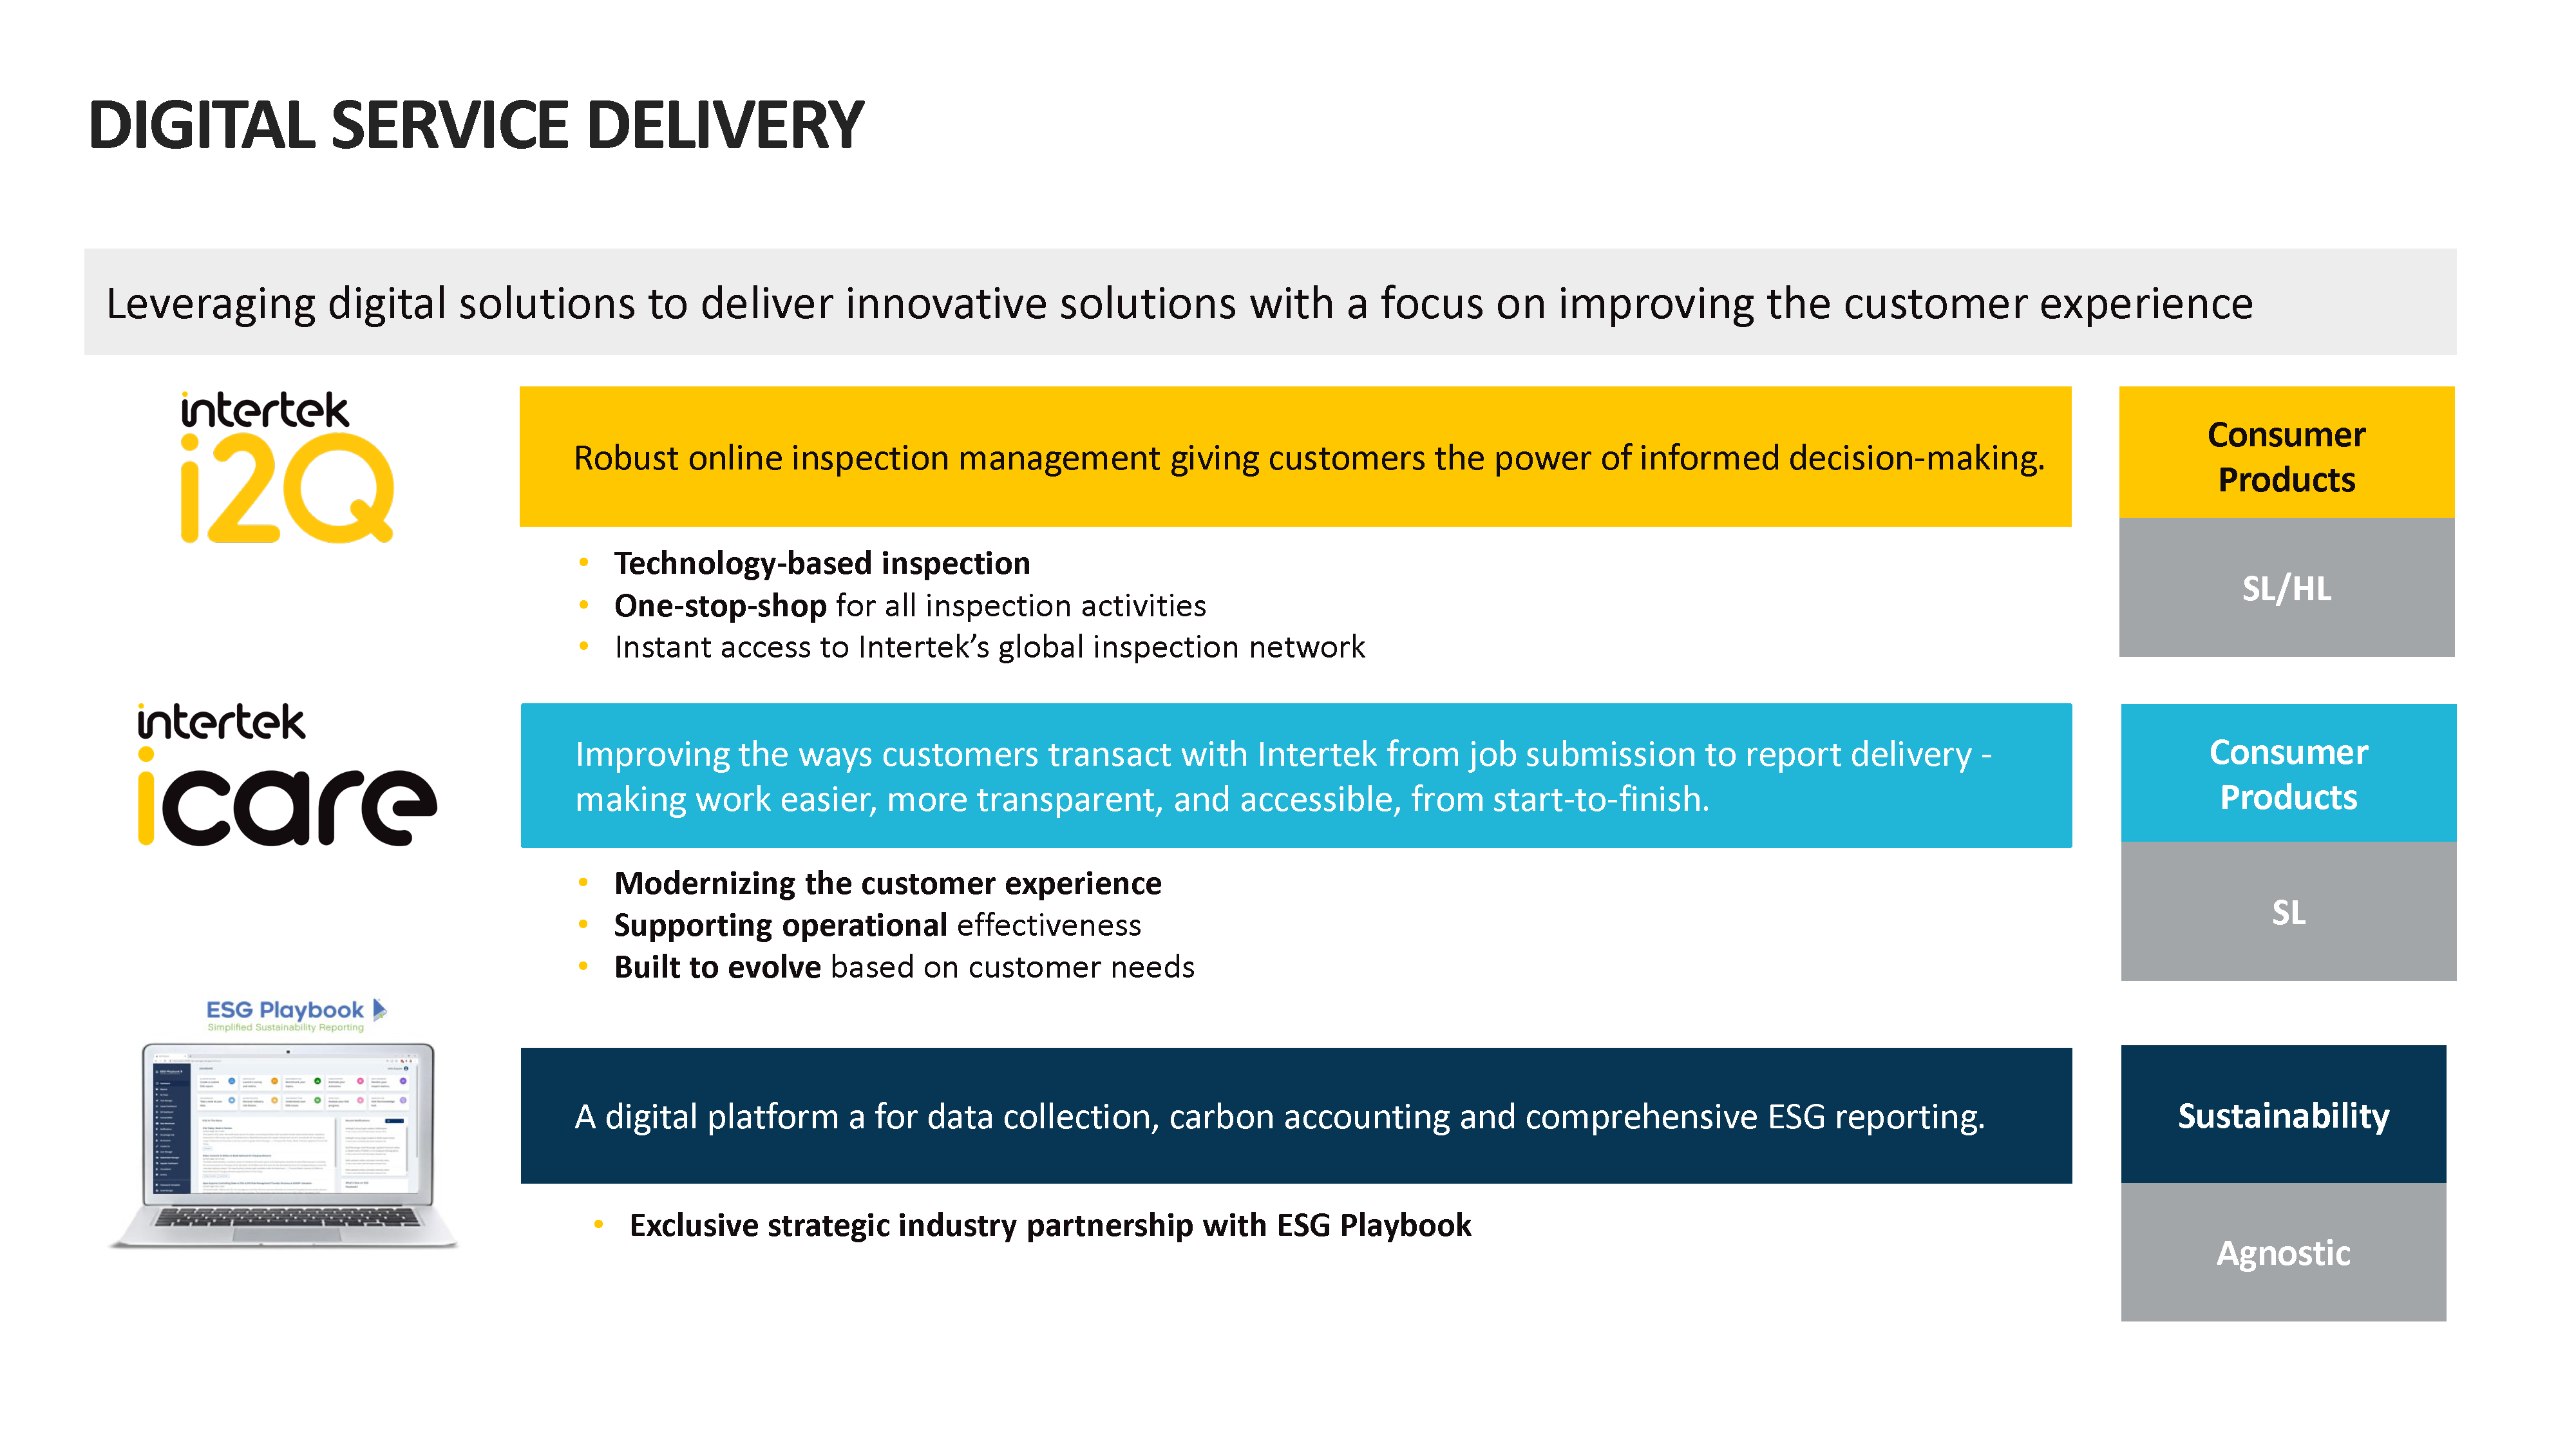
Our SaaS solutions play a critical role in enhancing our ATIC services by enabling the use of real-time data, enabling clients to make faster and more informed decisions. This results in greater transparency across the system and improves risk management.
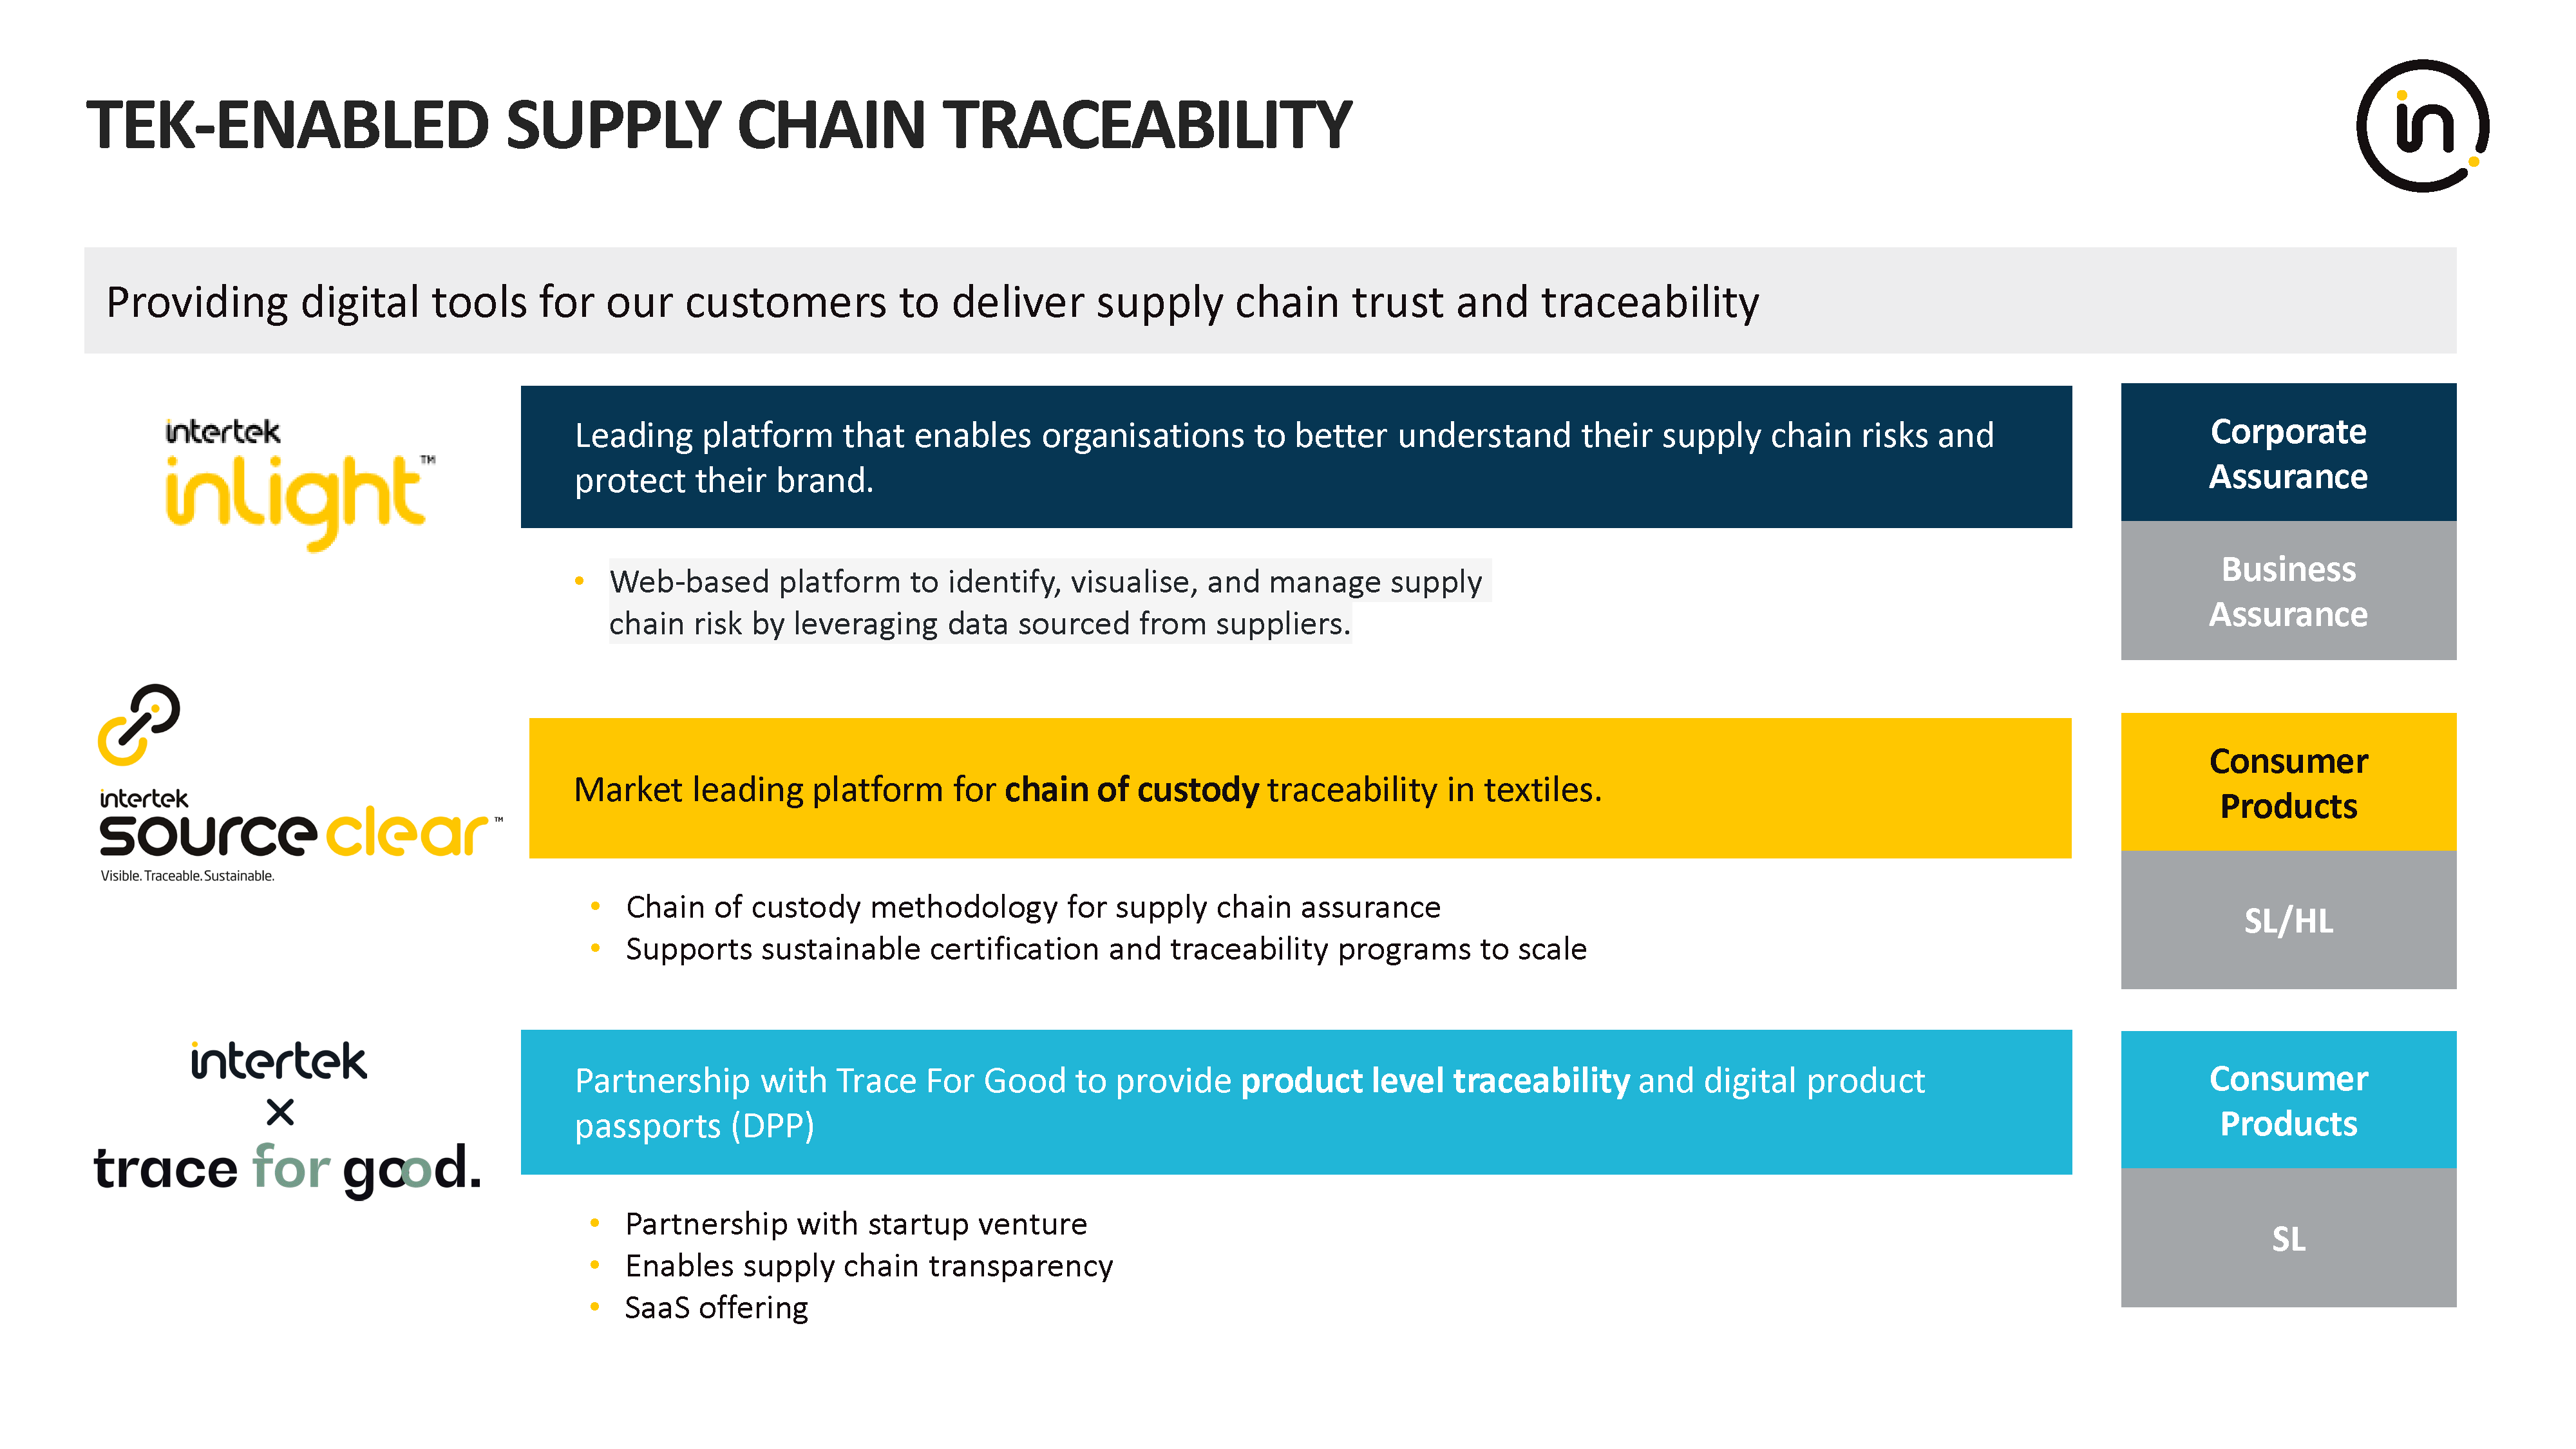
A key example is our ToxClear platform, a SaaS solution that helps clients identify and monitor harmful chemicals within their supply chains. By providing full visibility into chemical usage, ToxClear enables our clients to pinpoint areas for improvement and take steps towards detoxifying their supply chain.
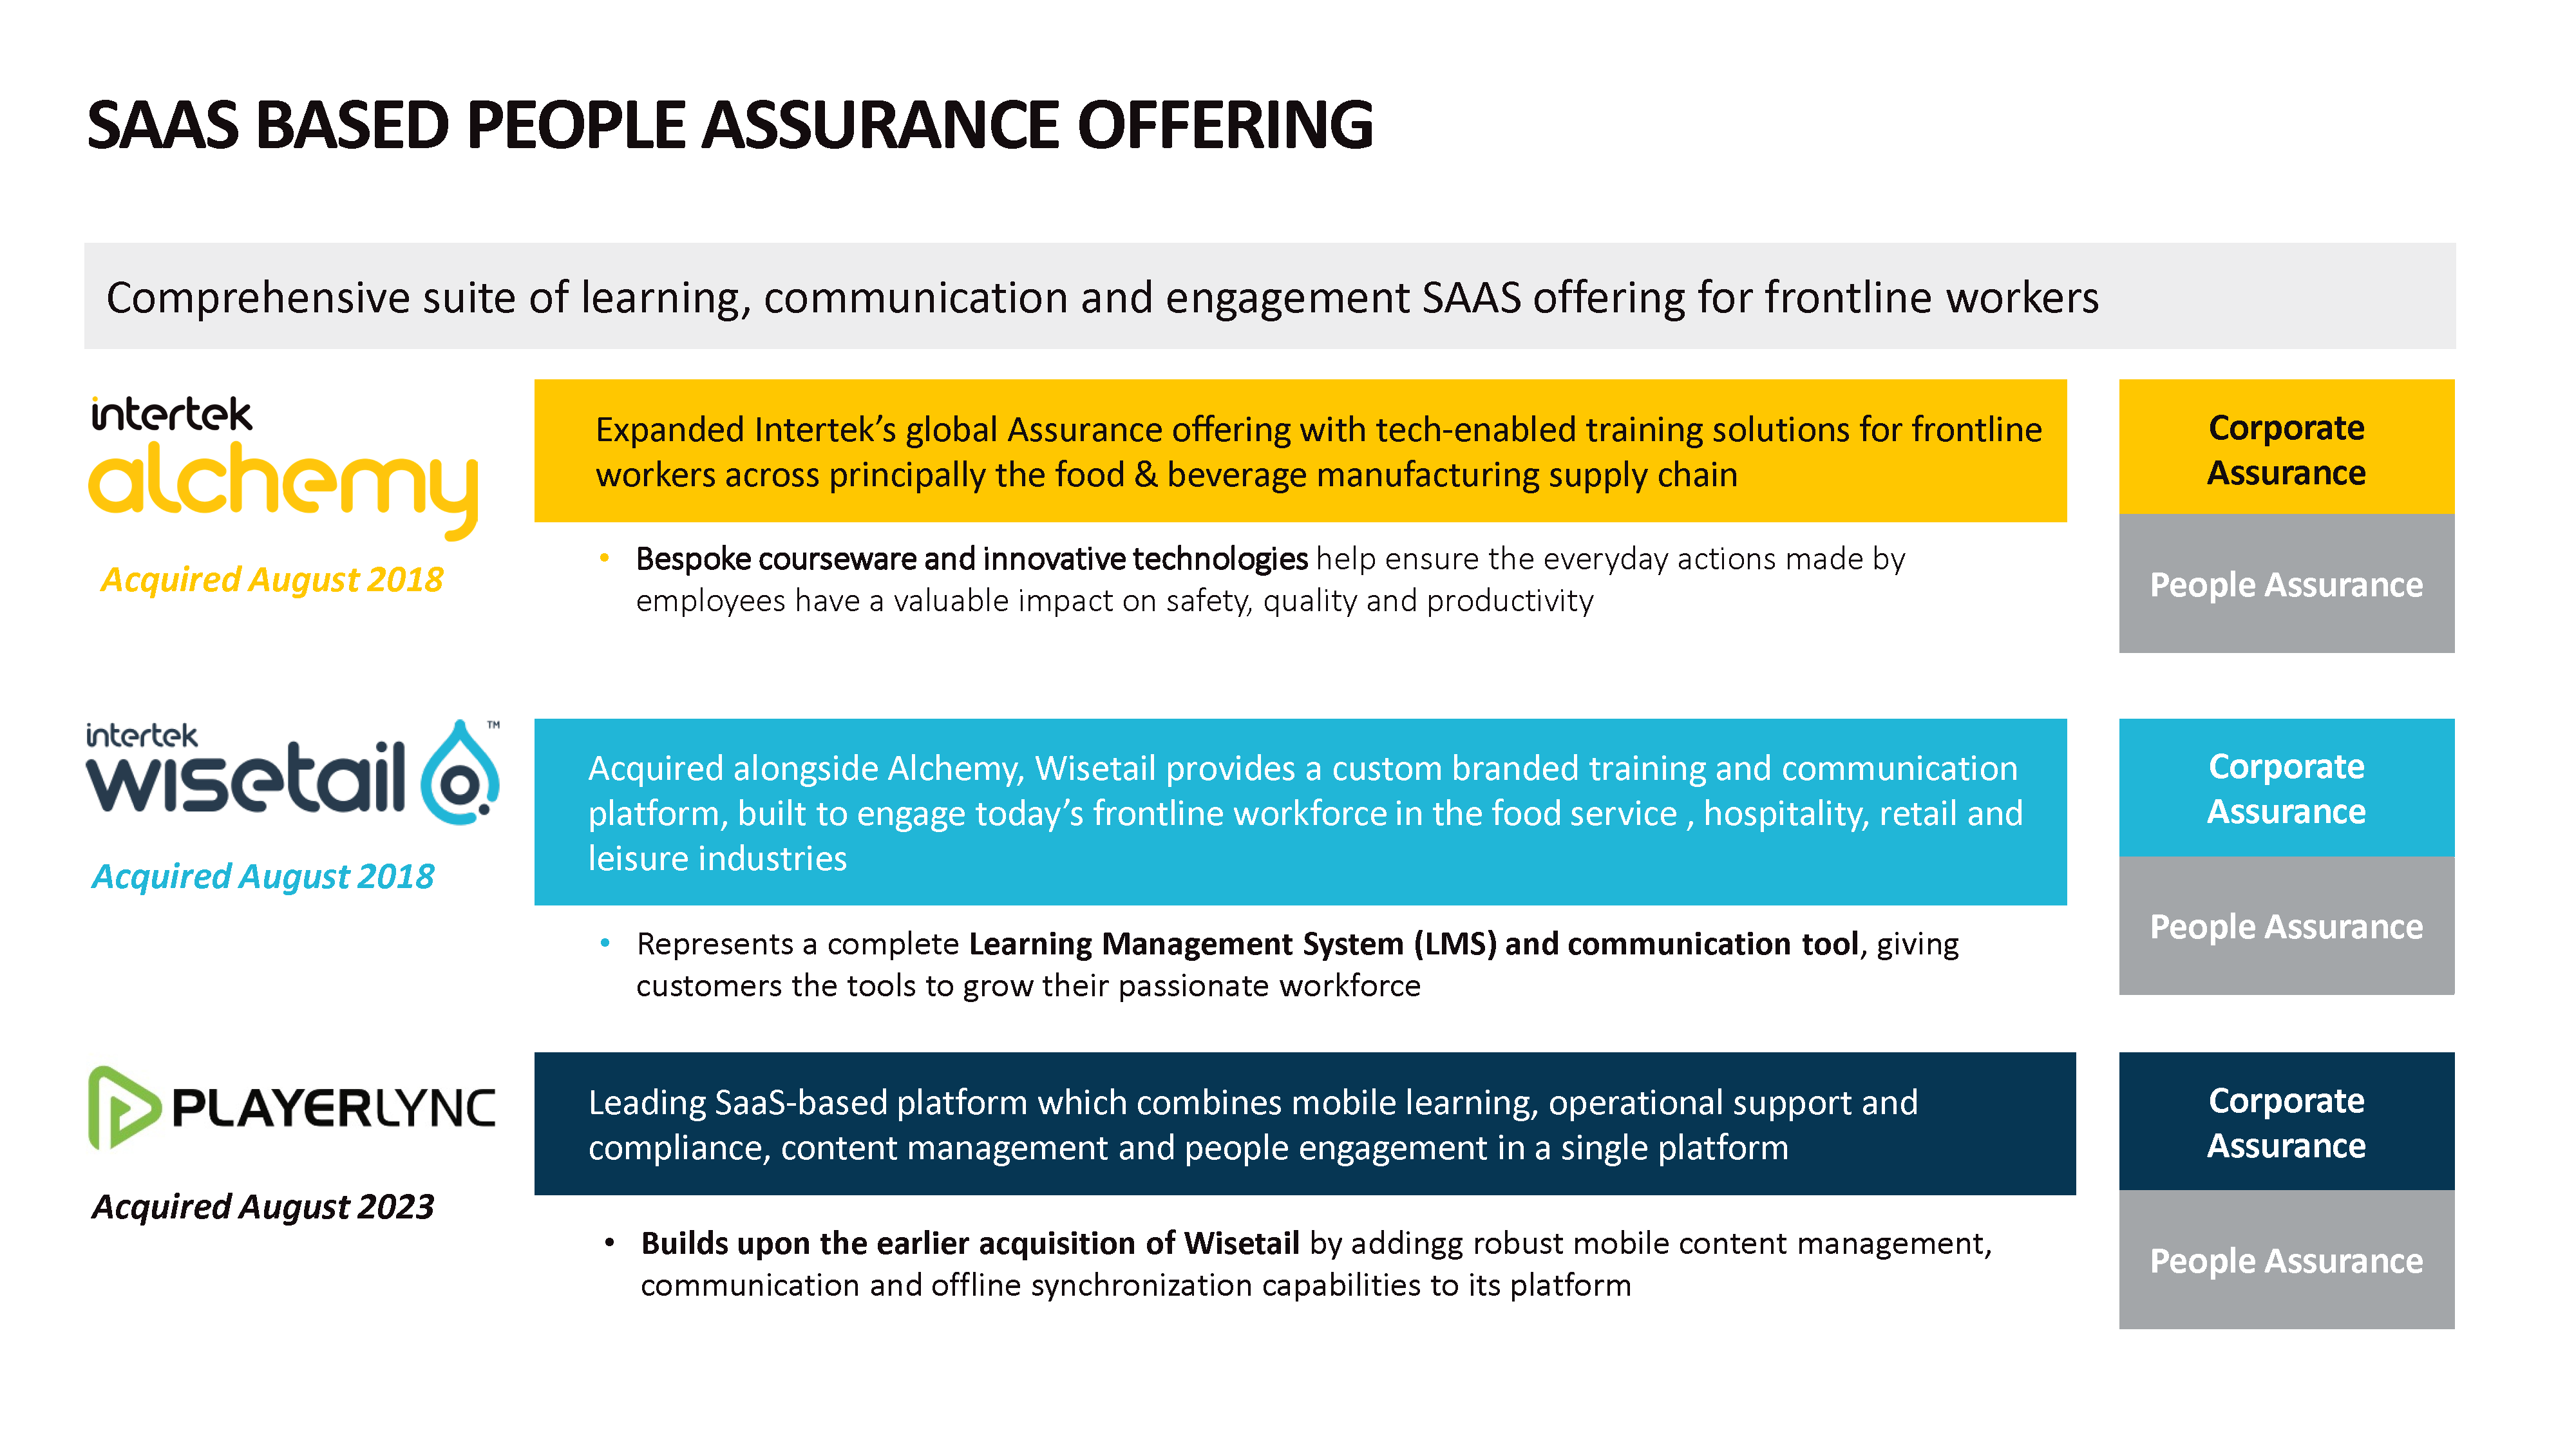
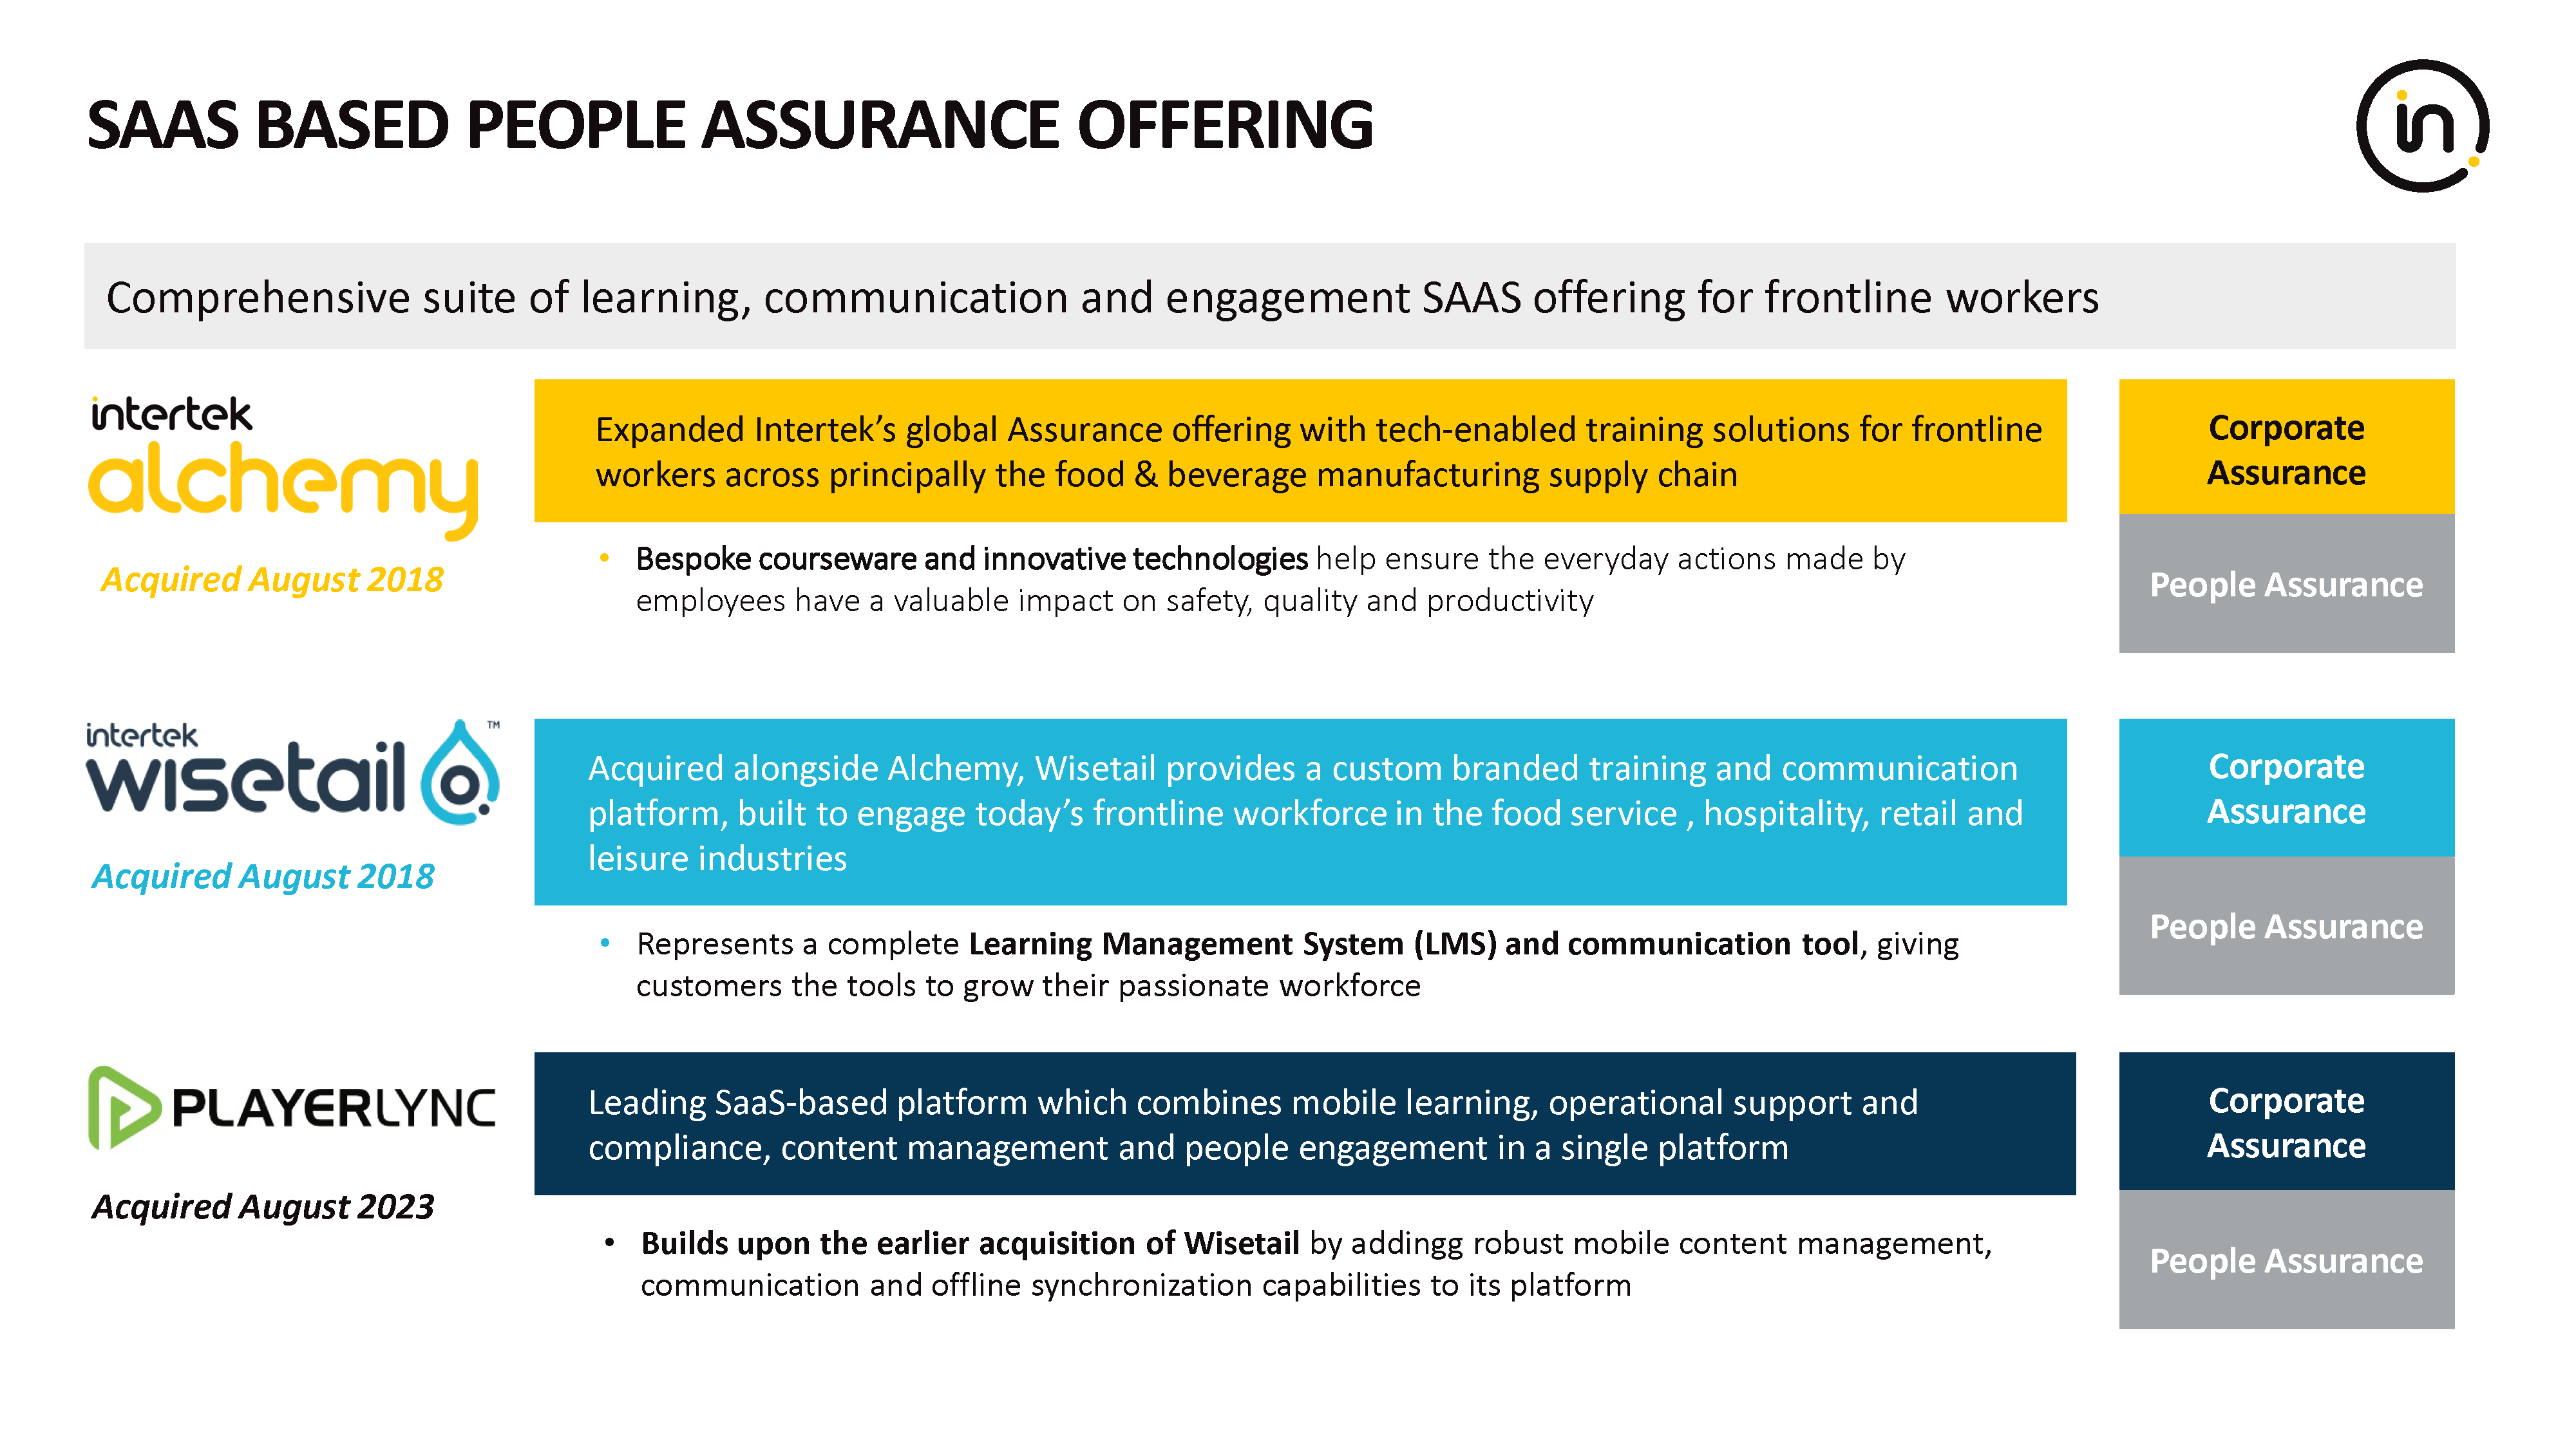
Another example of one of our SaaS solutions is Alchemy. Acquired in 2018, the SaaS solution address the critical skill gaps among frontline employees, particularly in the food industry. It is a learning platform that provides training to employees through identifying skill gaps and closing them, in addition to compliance.
Particularly critical in today’s world of uncertainty surrounding global trade and tariffs, SupplyTek is the world’s first end-to-end global market access solution turning supply chain uncertainty into a competitive advantage for its clients. It does this through three areas; Consulting, Training and Assurance. This enables companies to map their supply chain and assess risk. It also offers strategic advice on moving suppliers and market access regulations. Through the use of SupplyTek, companies can be assured that their people have the right capabilities.
SupplyTek
We view AI & Digitisation as an opportunity for our business when used correctly. Intertek has long pioneered the use of data to make informed decisions and improve efficiency throughout our operations. In addition, it can help provide faster feedback time to our clients, enabling them to access real-time data on issues within their supply chain.
With more than 130 years of quality and safety expertise across a wide range of industries, the launch of Intertek AI² expands Intertek’s industry-leading offering of ATIC solutions, providing a comprehensive, risk-based AI assurance programme built around industry-leading solutions and addressing governance, transparency, security, and safety. Services include:
- Governed AI services establish risk and quality management frameworks, AI governance structures, regulatory compliance strategies, and oversight mechanisms ensuring accountability and adherence to evolving requirements including EU AI Act obligations and ISO42001.
- Transparent AI services develop technical documentation meeting regulatory standards, implement appropriate explainability levels for different applications, and creates communication strategies making AI behaviour understandable to diverse stakeholders.
- Secure AI services deliver cybersecurity tailored to AI systems, red teaming exercises identifying vulnerabilities and failure modes, threat monitoring and incident response planning, and security architecture guidance addressing unique AI vulnerabilities.
- Safe AI services provide comprehensive testing and validation using AI-specific methodologies, data quality assessment and improvement, independent performance verification, and bias detection and mitigation across diverse populations and use cases
Intertek AI² - AI Assured: Smarter, Safer, Trusted
AAA Strategy
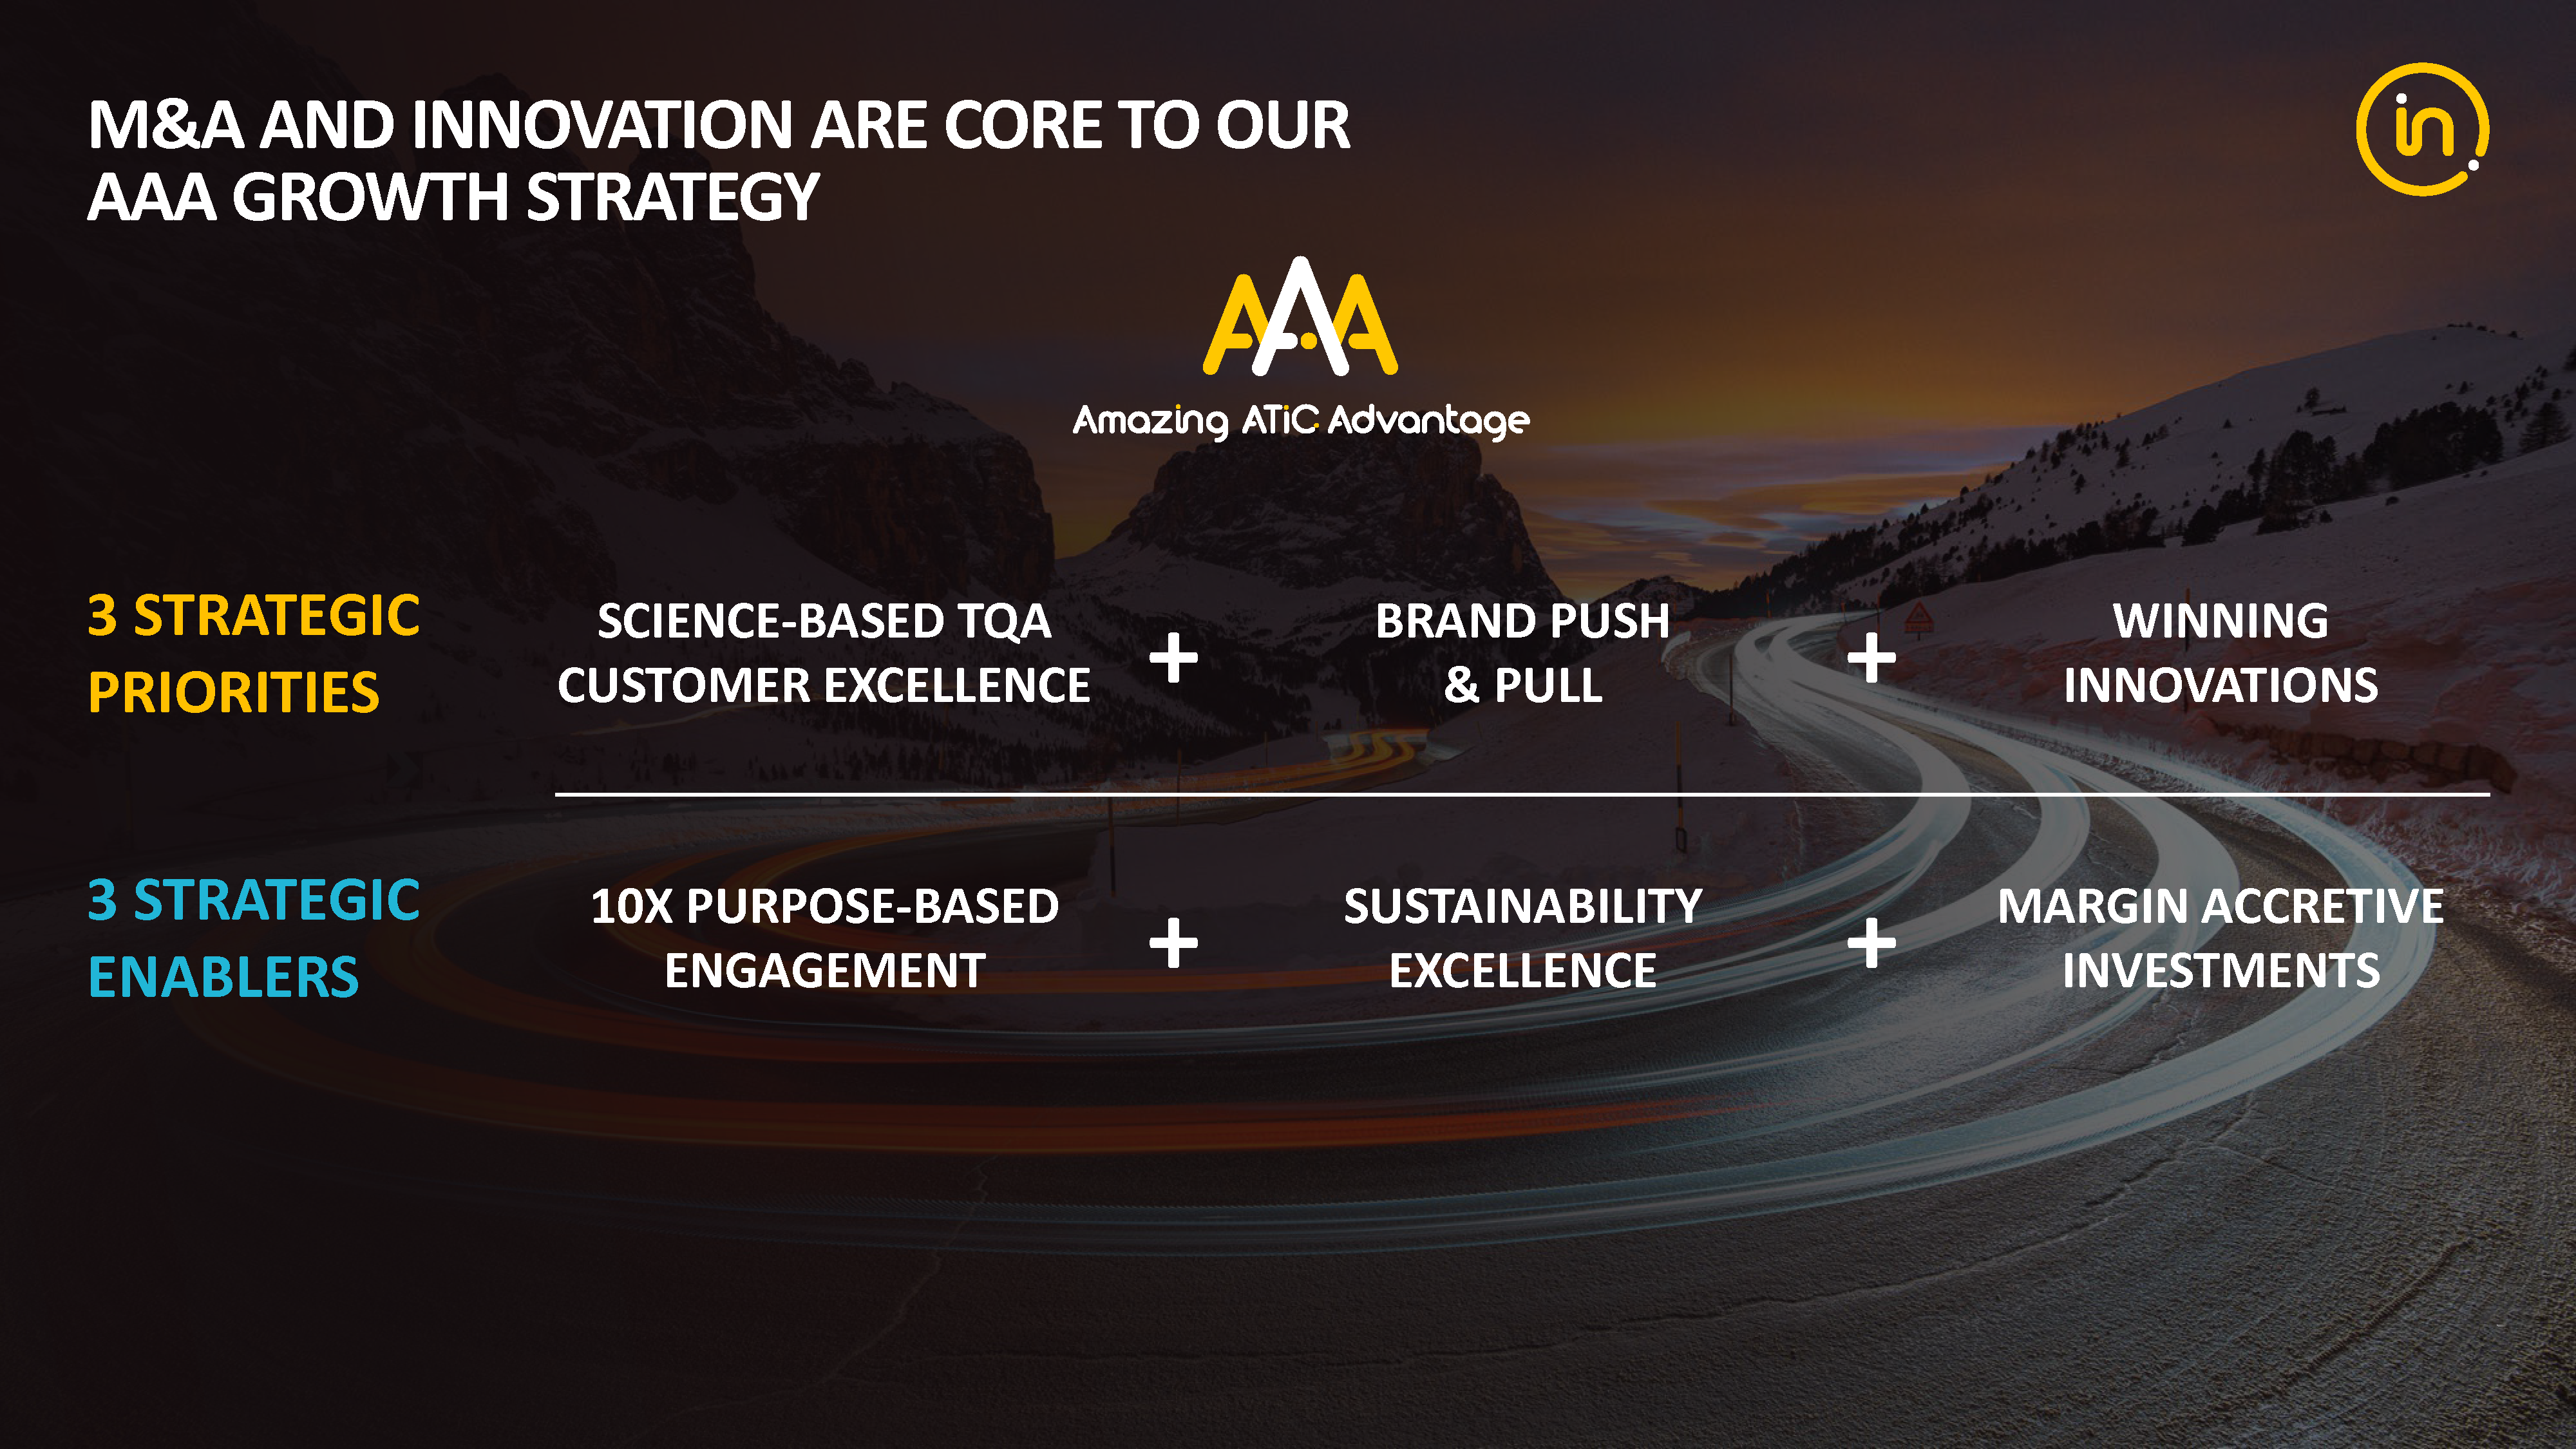
Our AAA strategy is very clear: to be the best in the industry everyday for our customers, employees, communities and shareholders.
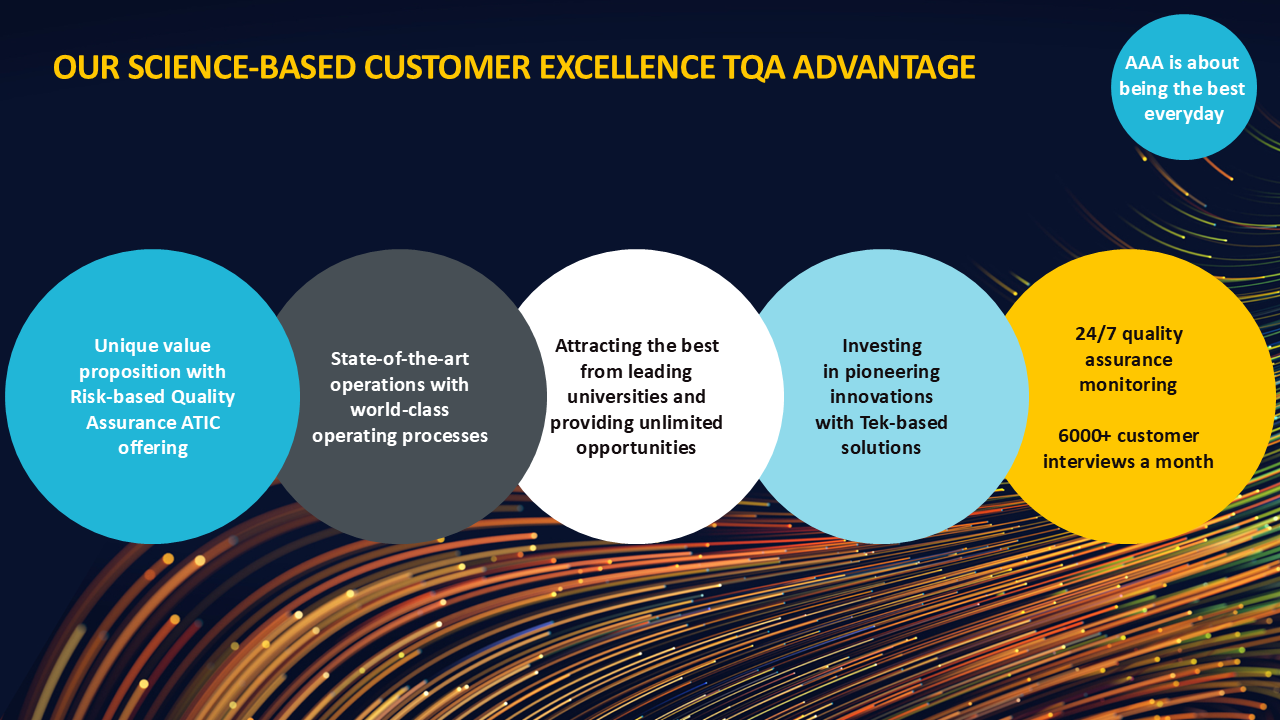
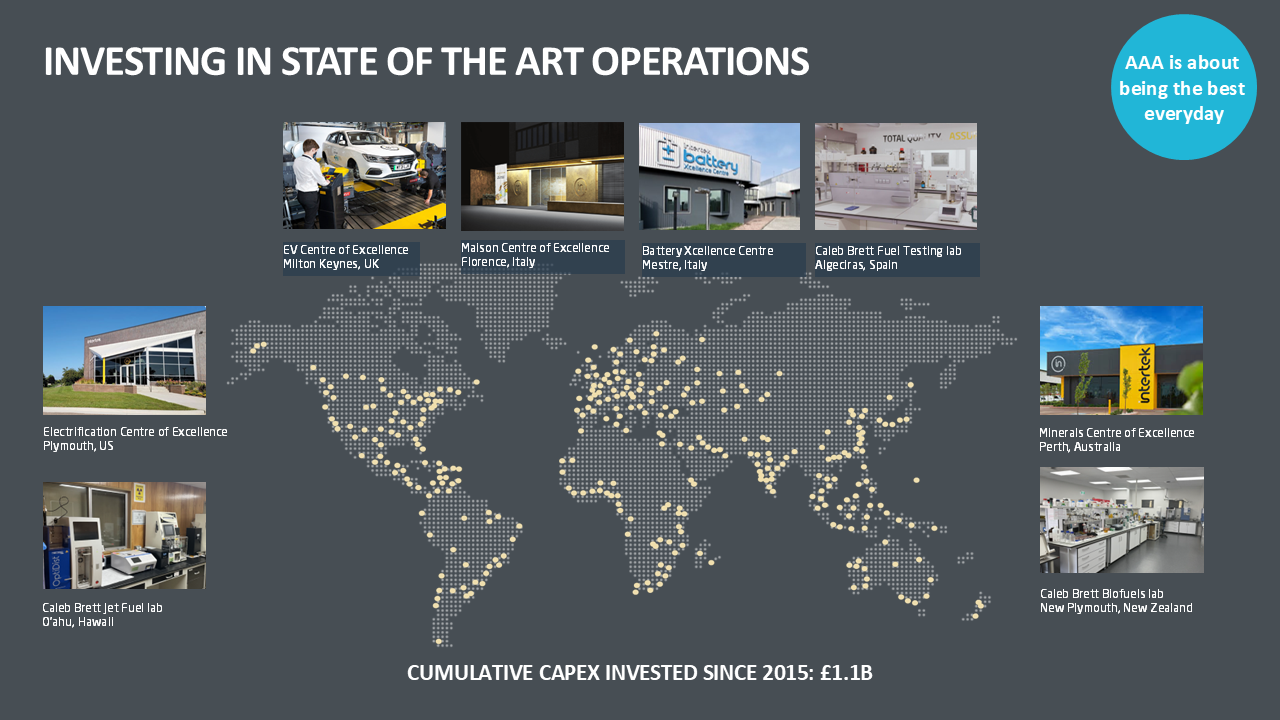
Our goal is to be the most trusted partner for our clients and to do so capitalise on our unique, science-based, ATIC value proposition. We are constantly investing our state-of-the-art operations, pioneering innovations which are largely technology-based and rigorously monitor our customer service performance.
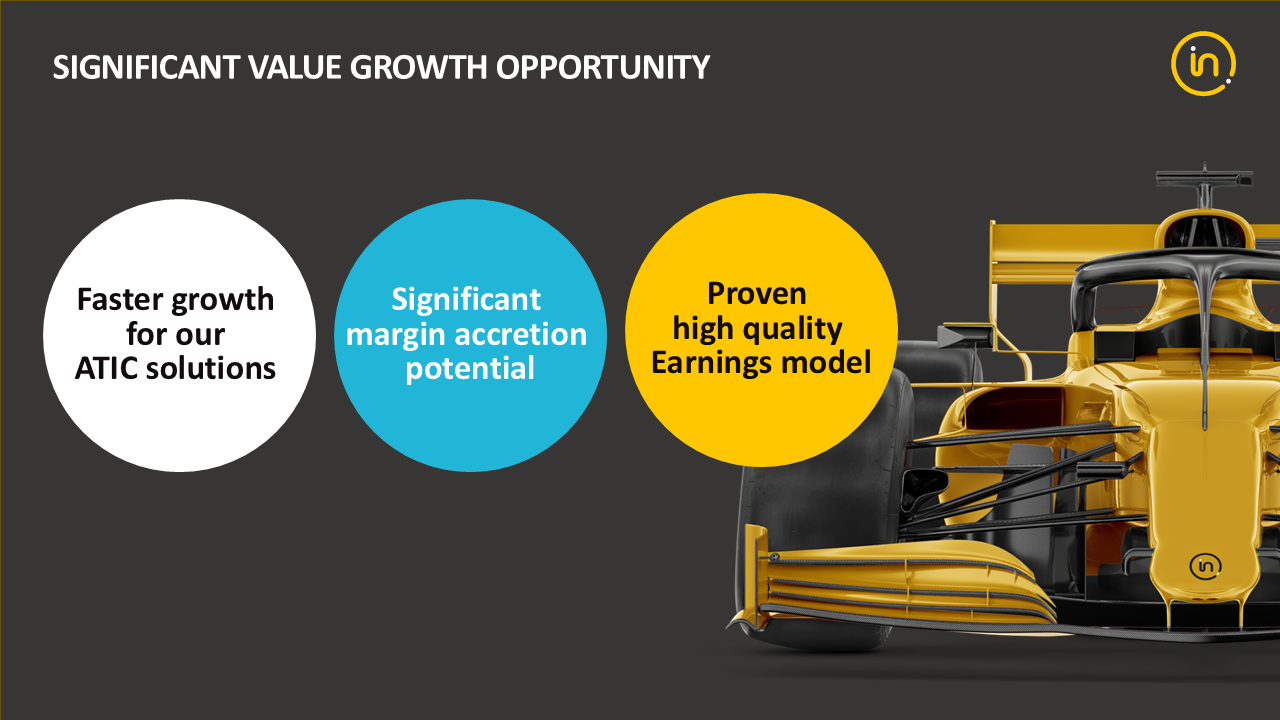
- Faster growth expected for our ATIC solutions as companies focus more on mitigating risks in their supply chains.
- Margin accretion potential to be achieved through portfolio mix, operating leverage, cost reduction, increased productivity and margin accretive investments.
- Our earnings model is a quality, cash compounding earnings, with a proven track-record. Between 2015 and 2025 we have grown our revenue by 58.5% and increased operating margin by 220bps. In addition, we have step changed our cash generation for the Group, delivered excellent ROIC and grown Dividend per Share.
In 2023, as part of our Capital Markets event in London we launched our AAA growth strategy. The idea behind it is to deliver AAA value for all stakeholders and be the most trusted partner for Total Quality Assurance. Our aim is to deliver MSD LFL revenue growth at CCY, margin accretive revenue growth (18.5%+ margin target, announced at our FY24 results), strong FCF, and disciplined capital allocation in high growth and high margin sectors.
We operate in more than 100 countries in a variety of markets and industries, ranging from consumer goods to the energy sector, and we deliver a wide range of ATIC services.
Our Science‐based Customer Excellence is at the core of our competitive advantage and enables us to deliver mission critical services for our clients.
Over the years we have built five enduring competitive advantages, which underpin our confidence moving forward.
- We operate a high quality growth portfolio poised for global growth with leading scale positions in attractive industries.
- We are the premium leader in Quality Assurance with our superior ATIC offering giving us the trust of our clients.
- Our high quality cash compounder earnings model delivers industry leading productivity and returns.
- Our high performance, science-based organisation attracts the best talents in the industry.
- Finally, we operate with a culture of doing business the right way, supported by strong controls, compliance and governance.
- The depth and breadth of our ATIC solutions positions us well to seize the increased corporate needs for Risk-based Quality Assurance.
- We see exciting growth opportunities for each of our Divisions.
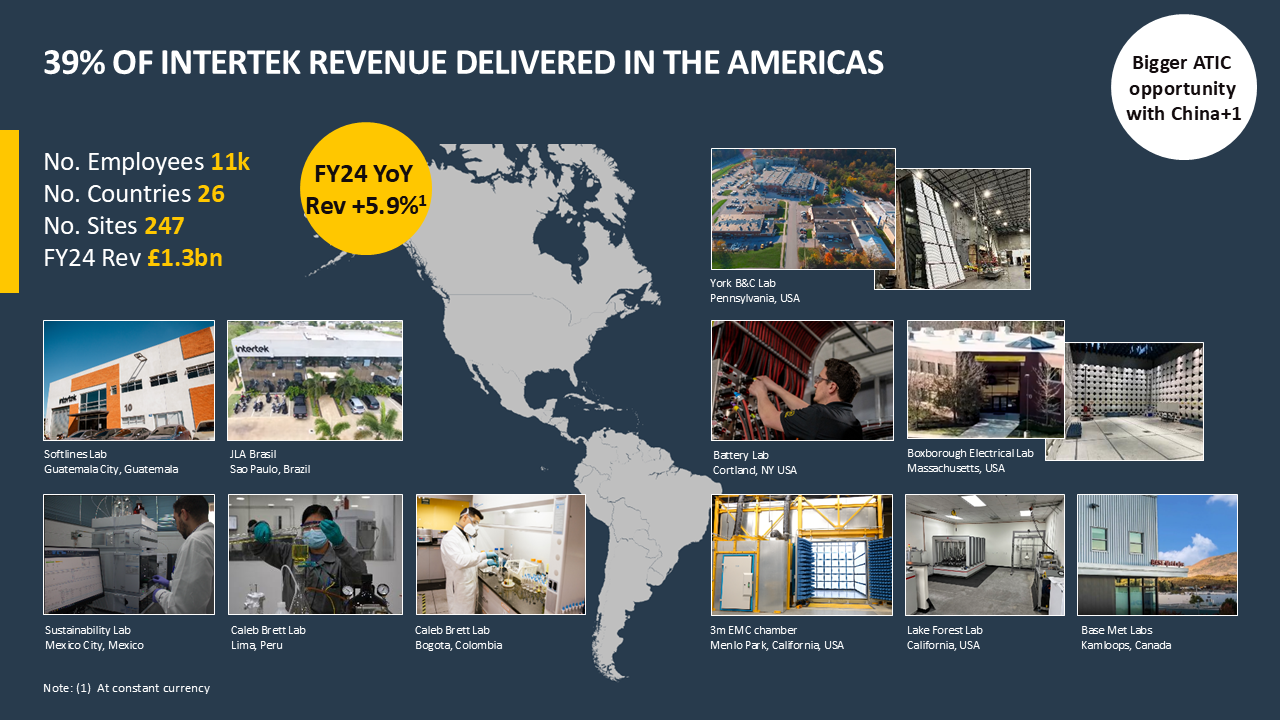
- Our revenues are well diversified by geography, and we enjoy strong positions in the USA (30% of our revenues) and in Asia-Pacific (39% of our revenues) which benefit from structural investment growth opportunities.
- Our portfolio mix is skewed to growth with 56% of our revenues exposed to the fast-growing segments, while 16% of our mix is Scale growth and 28% offers room for improvement.
Please note that the below slides are extracted from our FY 23 presentation and may not be fully up to date.
As part of our journey to reaching an 18.5%+ Operating Margin, we will continue to focus on volume-price-mix and cost management, while maintaining our focus on margin accretive investments and innovations.
Delivering margin accretive revenue growth throughout the business has been achieved through portfolio optimisation, cost discipline, operating leverage and margin accretive investments.
Please note that the below slides are extracted from our FY 23 presentation and may not be fully up to date.
A key component of our superior returns is our accretive capital allocation policy.
We allocate capex and working capital, targeting four to five percent of revenue, to support growth and since 2015, we have invested £1.25bn in capex.
In terms of shareholder returns, our goal is to grow dividends over time with a payout ratio around 65% percent.
Selective acquisitions to strengthen our leadership positions are important and we have invested £1.4bn in M&A since 2015.
Lastly, our goal is to operate with a leverage target range of 1.3-1.8 net debt to EBITDA and return excess capital when it cannot be deployed at attractive returns.
Accretive Capital Allocation Framework
Disciplined, balanced and clear
To better align management priorities with that of stakeholders, incentives are aligned to short-term and long-term financial and sustainability metrics.
We operate a high-quality cash compounder earnings model, focusing on the compounding effect year after year of high-quality margin accretive revenue growth, strong free cash flow and superior returns. We aim to deliver significant value for every stakeholder.
Assurance is the assessment of quality, safety and sustainability processes within company supply chains. With growing complexity in their nature, we provide an audit of company supply chains to identify and eliminate risks. This is done using real-time data which enables companies to detect issues instantly.
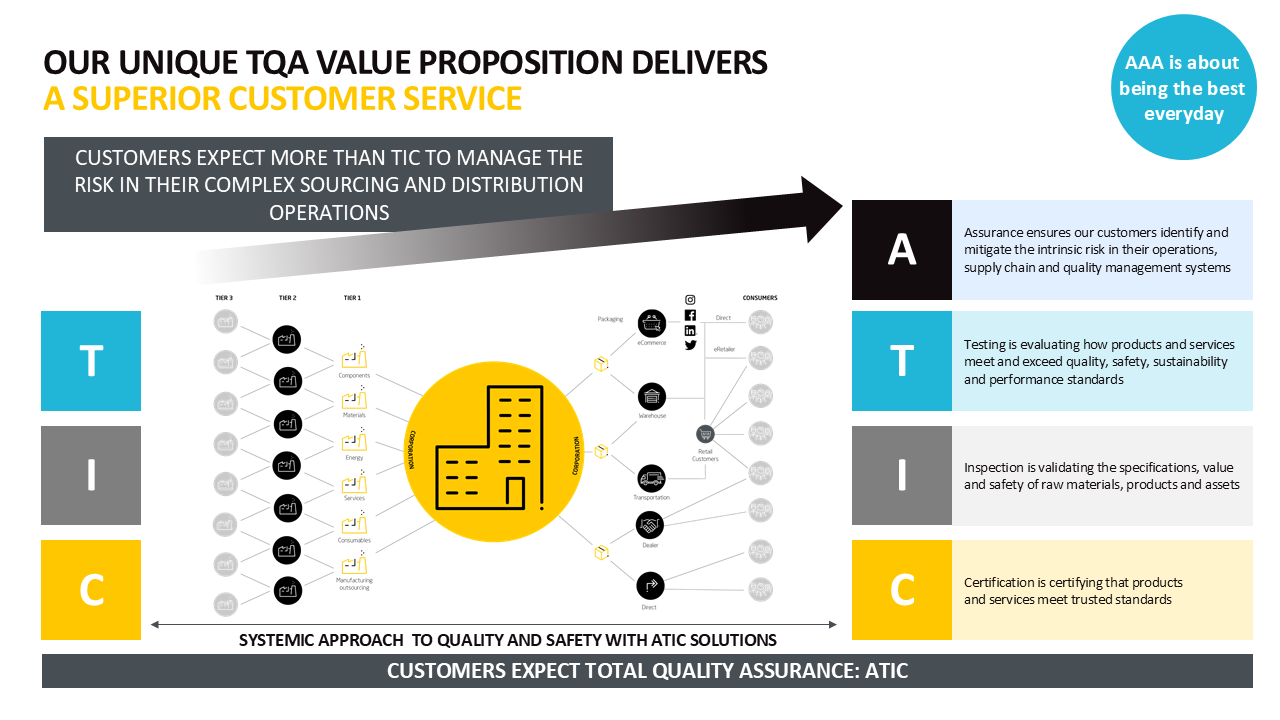
Our ATIC solutions ensure an end-to-end assessment of the risks within supply chains, ensuring superior customer service to clients. The whole ATIC offering assesses internal and third-party supply chain risks while also providing our Testing, Inspection and Certification services.
Capital Markets Event Presentations
We are operating in a higher organic growth market with very attractive ATIC growth opportunities. Factors such as regulation, innovation, technology and emerging risks across supply chains have prompted companies to focus their investments on Risk-based Quality Assurance over the last couple of decades.

Covid-19 highlighted the fragility of global supply chains and the unidentified risks within them. As such, companies have been investing more in securing their supply chains, ensuring diversification. In addition, there has been increased investment in data protection, training and independent assurance.
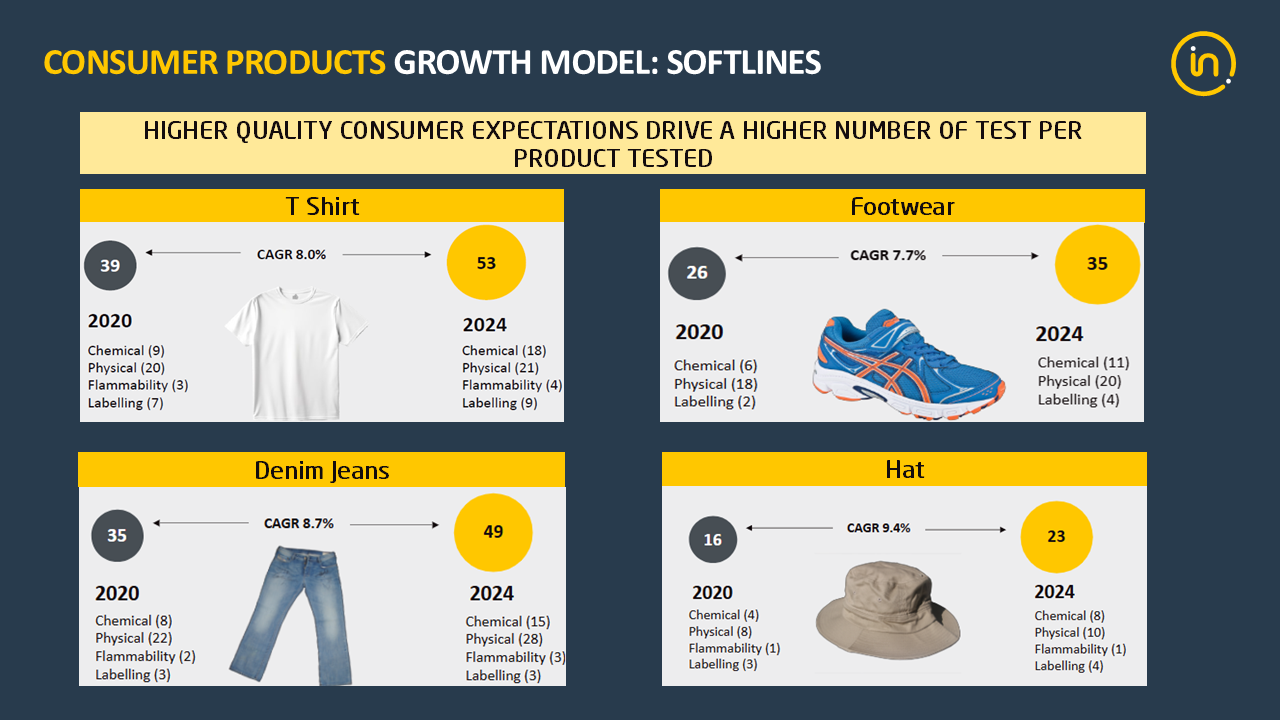
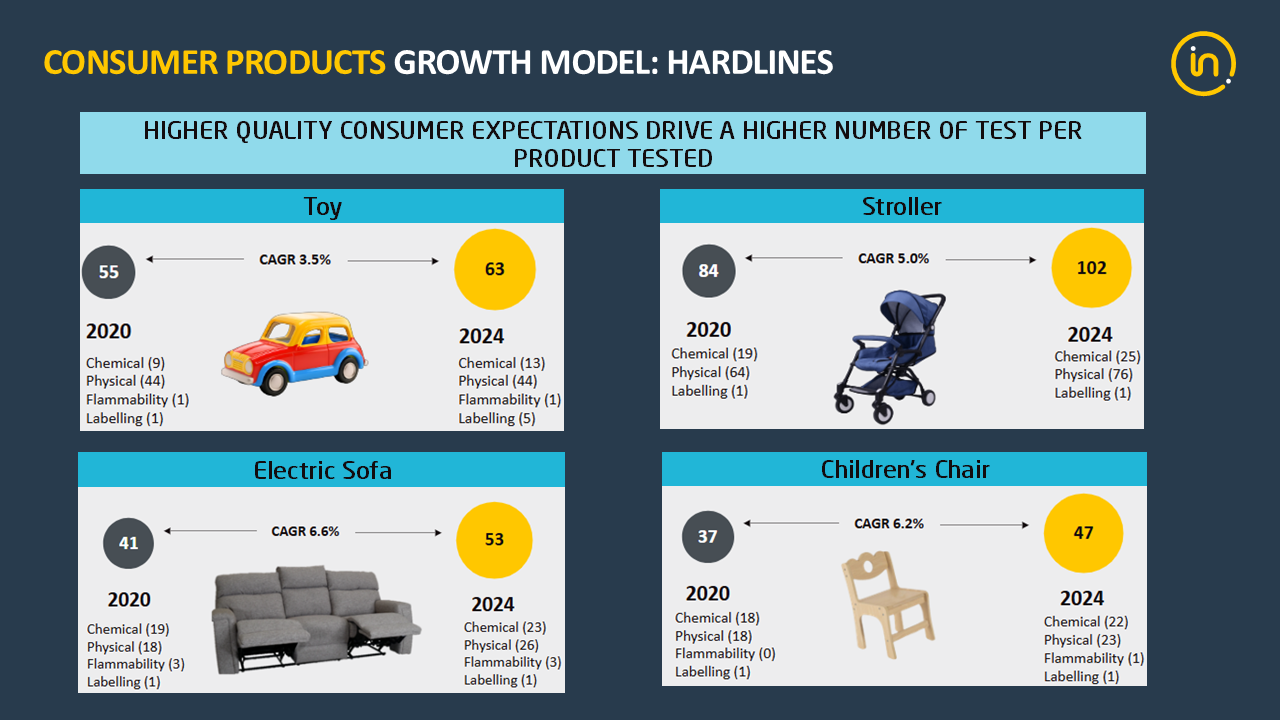
With innovation cycles shortening thanks to technology, our clients realise the importance of investing in order to maintain their competitive advantage. These investments in innovation mean a higher number of SKUs and a higher number of tests per SKU.
Sustainability regulations are constantly evolving with a greater number of companies facing mandatory abidance instead of opting in. This is a key driver for our business as the path to net zero has become a priority for many companies.


Growth potential in Energy-related activities is driven by the increasing shift towards renewables and the path to net zero. In addition, traditional energy activities remain an integral part of our revenue.
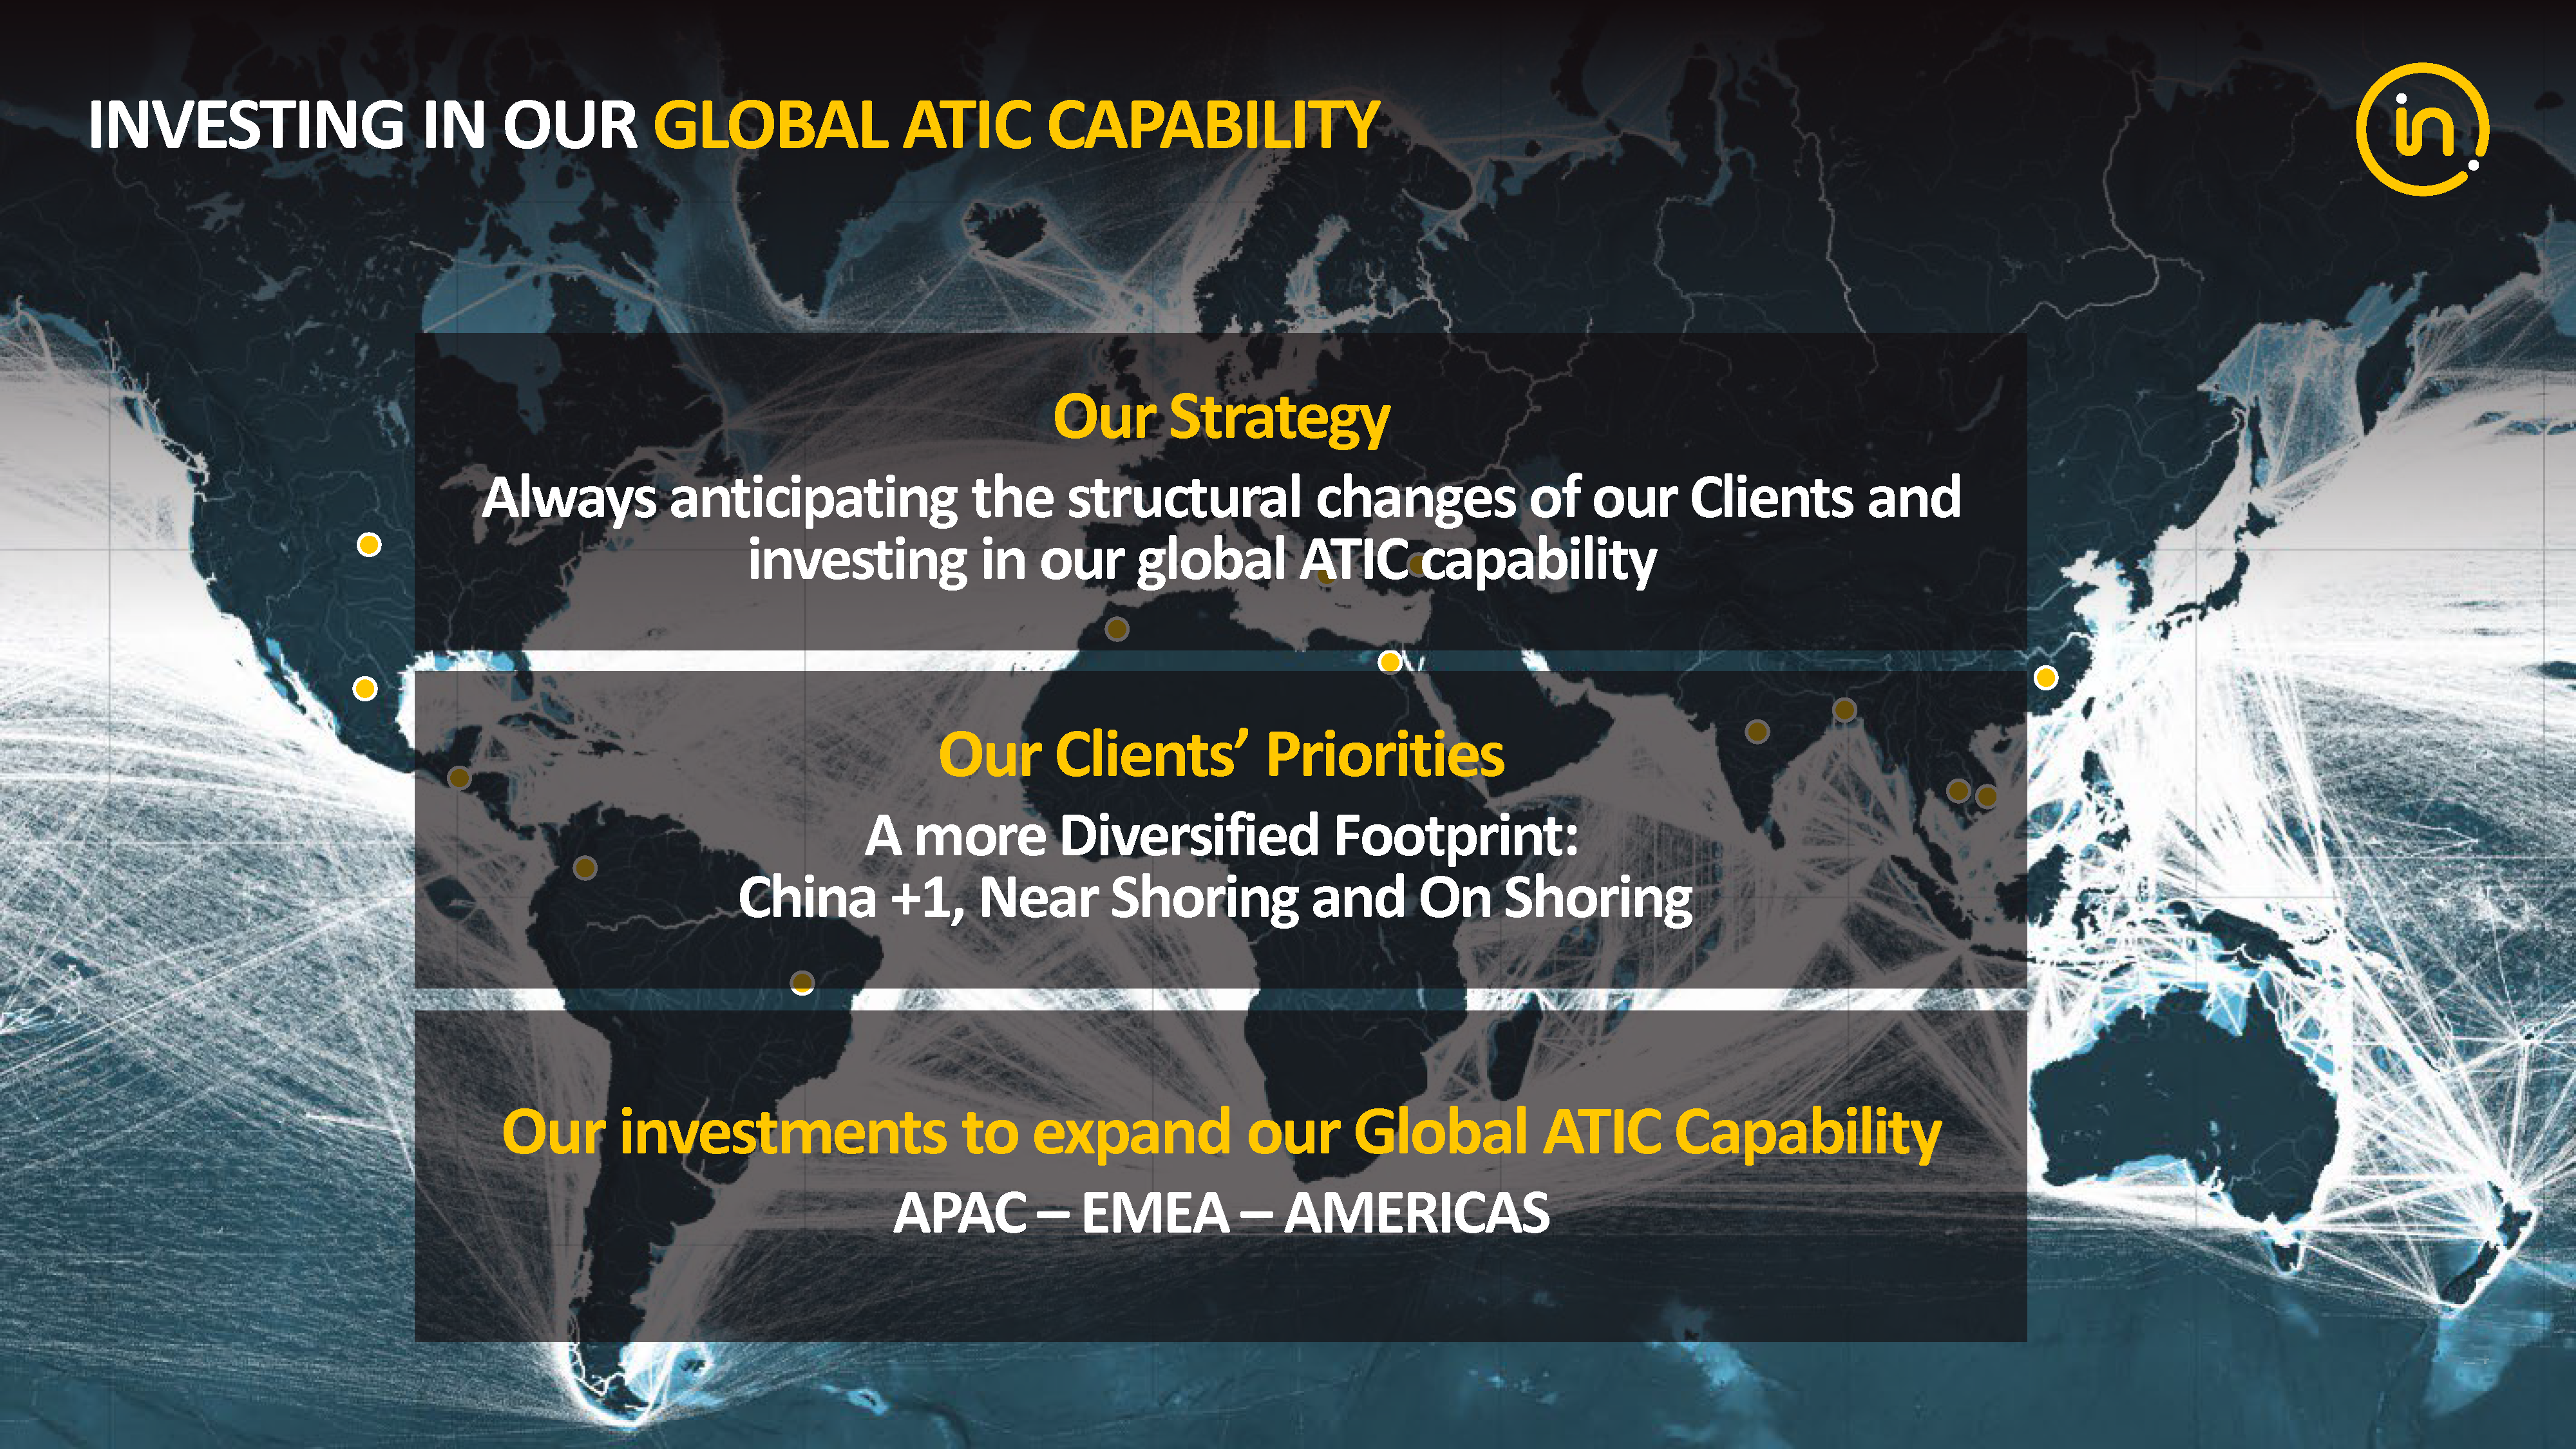
Supply chains never stand still, and as such our investments have never been focused on one area or region. Our global footprint and capital-light business model means we are very agile, giving us the ability to move fast if we need to build additional ATIC capability for our clients in existing or new markets.
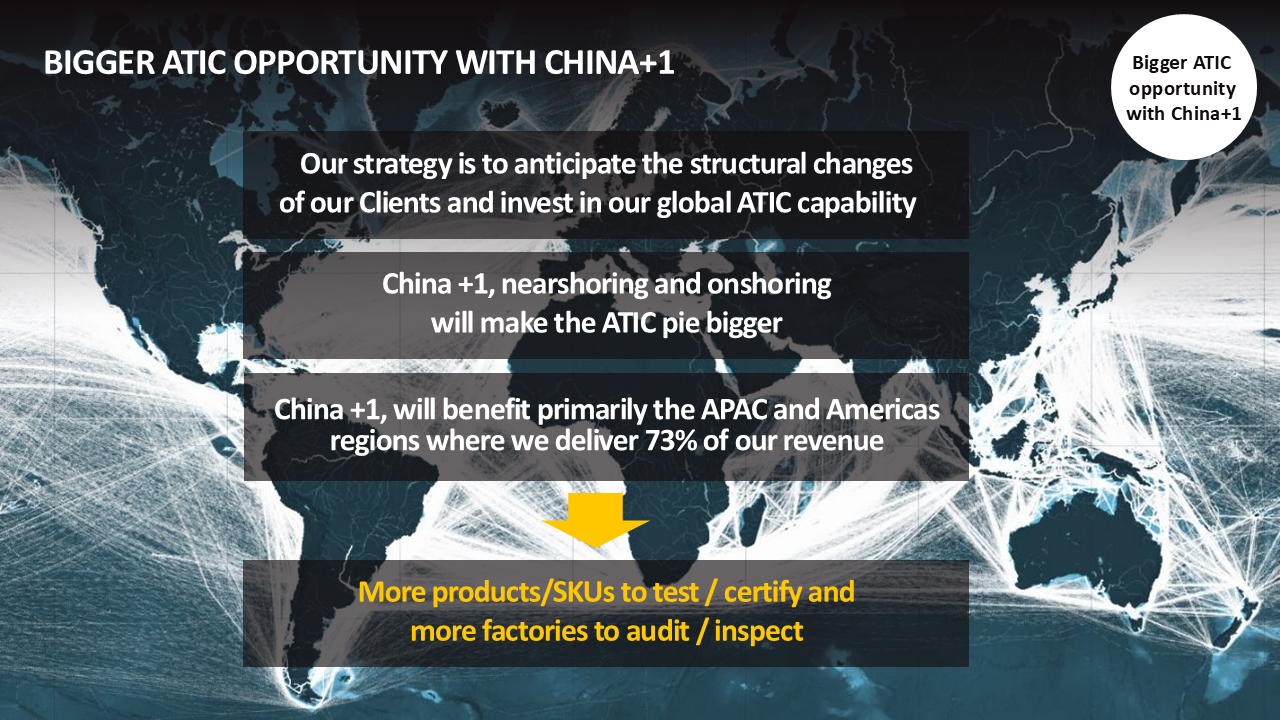
Our priority is to drive growth first the number of SKUs in the global market that need to be tested and certified, and second the number of factories and tier 1/2/3 suppliers that we need to audit and inspect.
China+1 is making the ATIC market larger for Intertek, with an increase in the number of products to test and plants to audit
Our investments have historically spanned across many regions and we constantly scan for new opportunities, be that organically or inorganically. We look for opportunities in high growth areas that will provide scale and augment the value Intertek currently offers.
Please note that the below slides are extracted from our HY 24 presentation and may not be fully up to date.
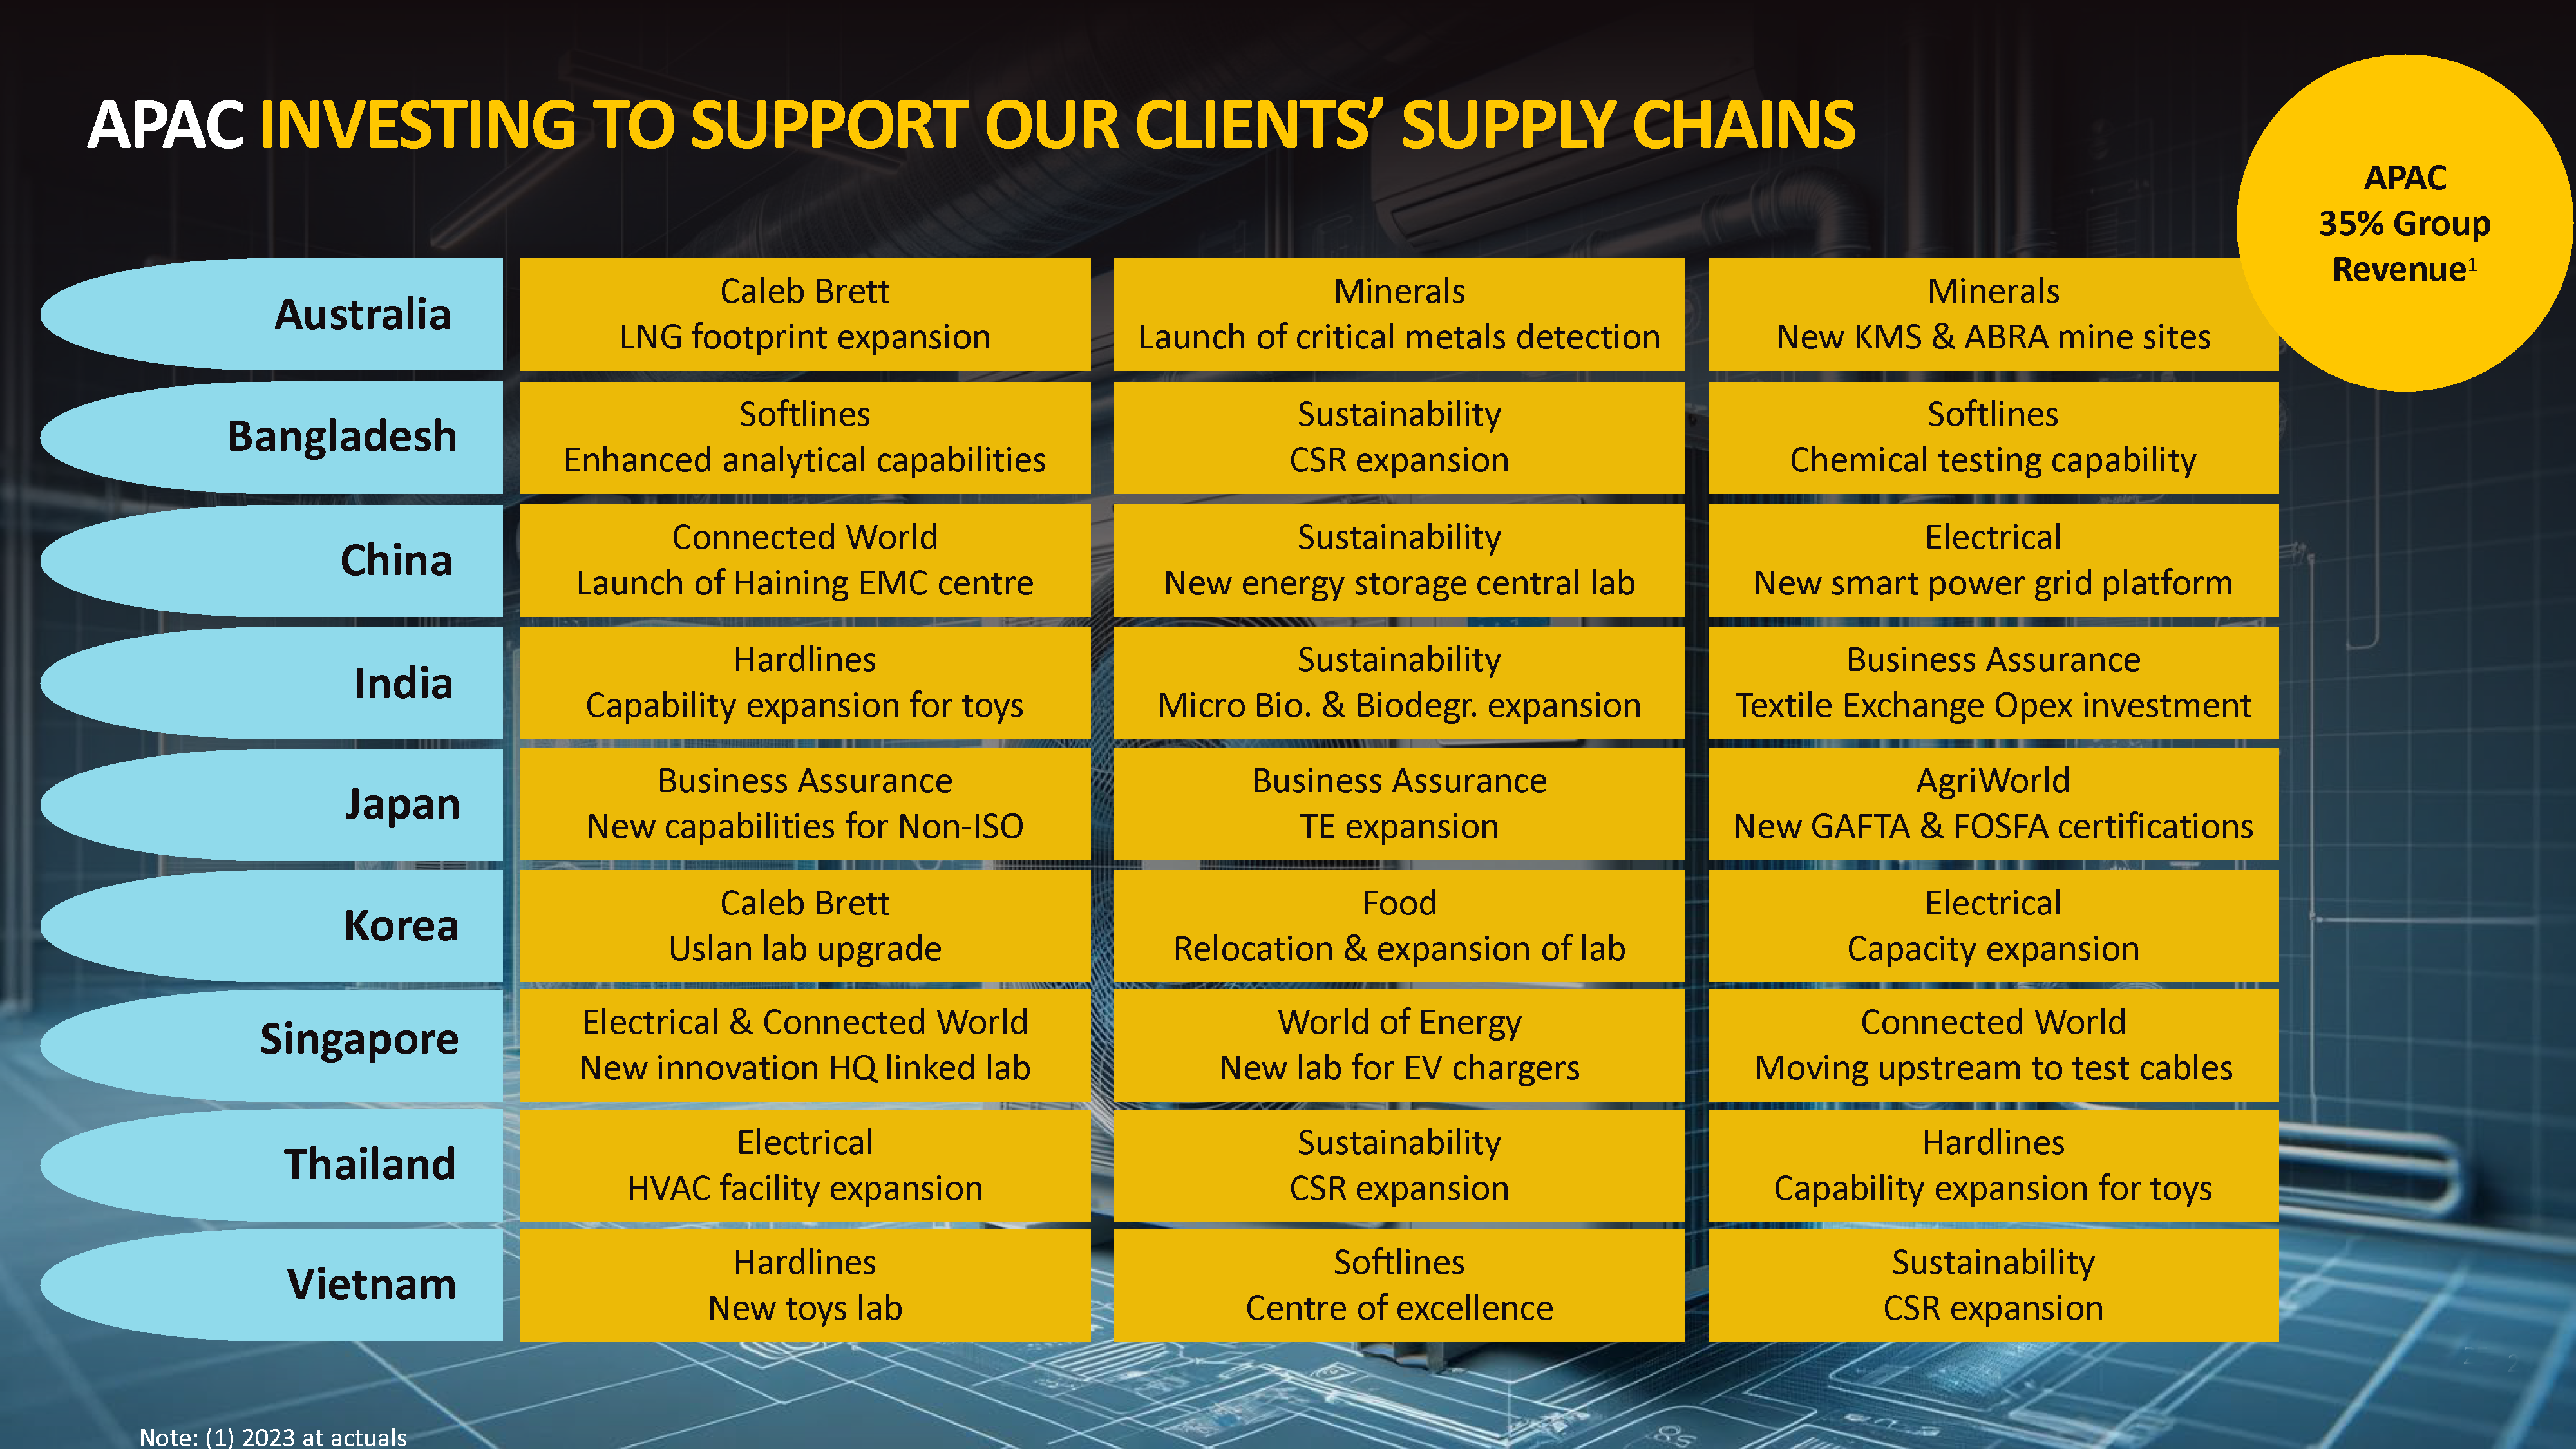


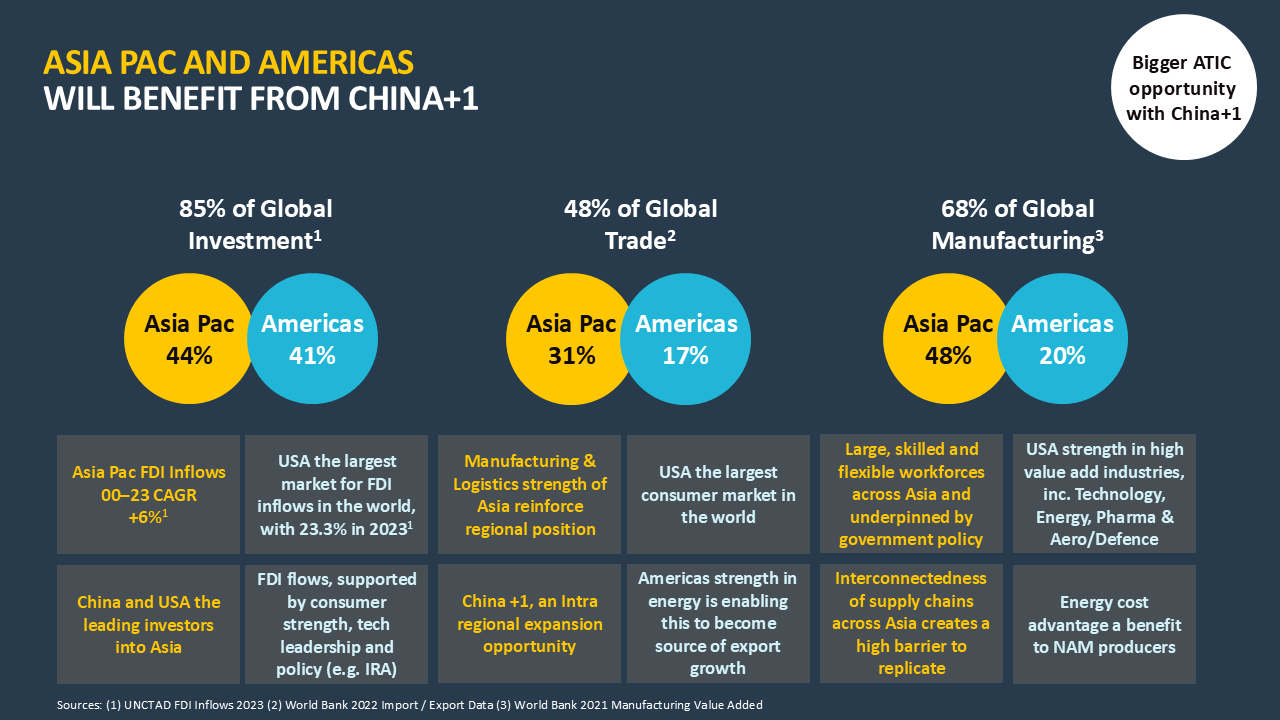
Both APAC and the Americas will benefit from China+1 as these are the two vibrant economic regions in terms of investments in additional supply chain capability. The two regions represent 68% of global manufacturing and 85% of the global investments that are currently made.
We have invested both organically and inorganically over the past few years and are well positioned to benefit with these two regions representing 73% of Intertek revenues
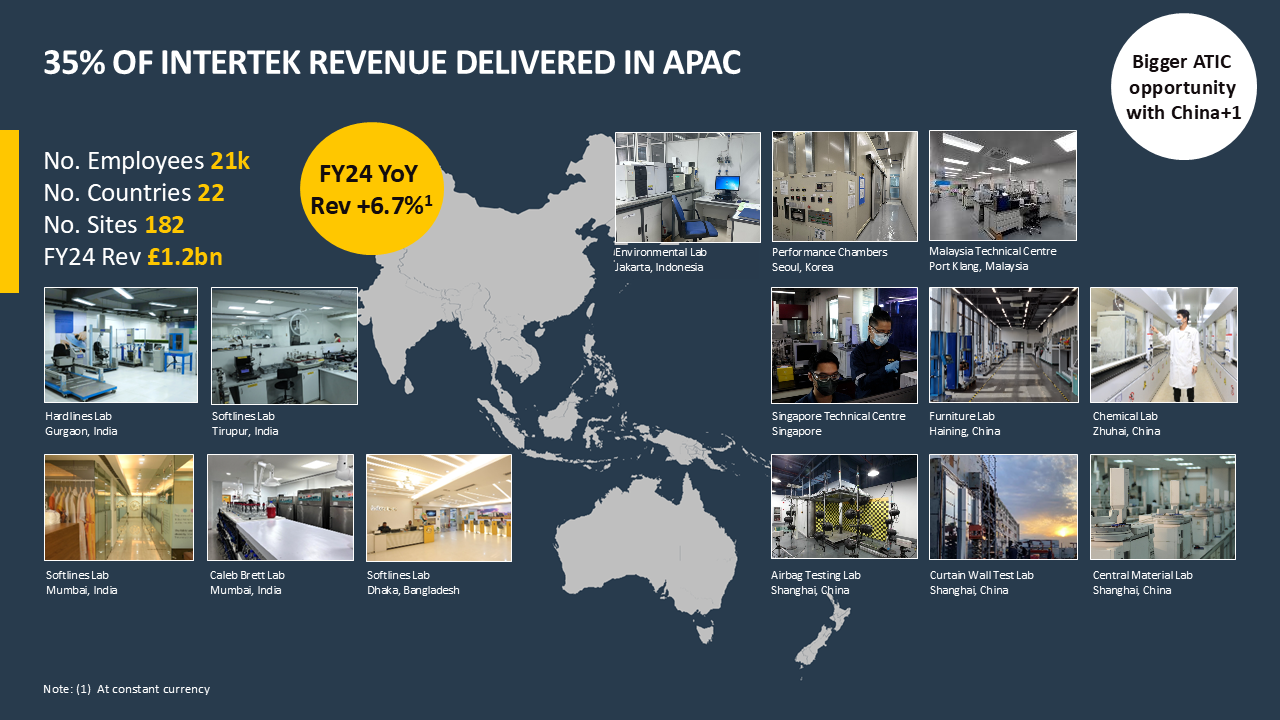
Our Chinese operations have experienced a robust performance with 6.7% lfl revenue growth in FY24. We have seen good growth, both in our export-driven activities (75% of revenues) and in our domestic-focused activities (25%).
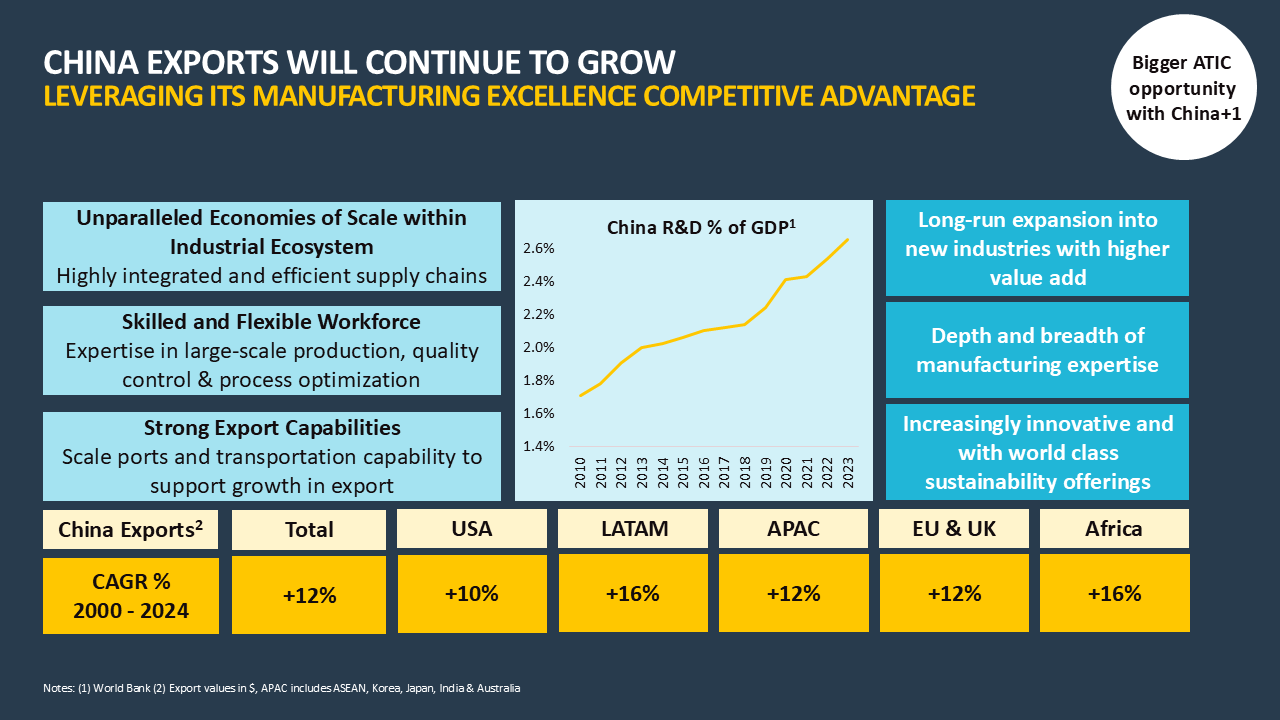
China +1 not only allows companies to diversify their supply chain but will result in more SKU’s to be tested across various markets and to various standards, providing a growth opportunity for Intertek.
Intertek has created a number of successful breakthrough innovations over the years. The most recent example of this is AI², a comprehensive, risk-based AI assurance programme built around industry-leading solutions and addressing governance, transparency, security, and safety. Another example is Intertek ToxClear, a digital sustainable chemical management platform that helps firms with the traceability of chemicals throughout their supply chains.
Our SaaS solutions play a critical role in enhancing our ATIC services by enabling the use of real-time data, enabling clients to make faster and more informed decisions. This results in greater transparency across the system and improves risk management.
A key example is our ToxClear platform, a SaaS solution that helps clients identify and monitor harmful chemicals within their supply chains. By providing full visibility into chemical usage, ToxClear enables our clients to pinpoint areas for improvement and take steps towards detoxifying their supply chain.
Another example of one of our SaaS solutions is Alchemy. Acquired in 2018, the SaaS solution address the critical skill gaps among frontline employees, particularly in the food industry. It is a learning platform that provides training to employees through identifying skill gaps and closing them, in addition to compliance.
While the ATIC industry in its nature is quite labour intensive, Intertek has been leveraging digital solutions for some time to improve the service provided to customers. In addition to many technology-based solutions including the innovations AI² and ToxClear, technology-based inspection is a tool provided by Intertek which customers can use to make informed decisions. This can be accessed in real-time via the platform.
We view AI & Digitisation as an opportunity for our business when used correctly. Intertek has long pioneered the use of data to make informed decisions and improve efficiency throughout our operations. In addition, it can help provide faster feedback time to our clients, enabling them to access real-time data on issues within their supply chain.
Sustainability
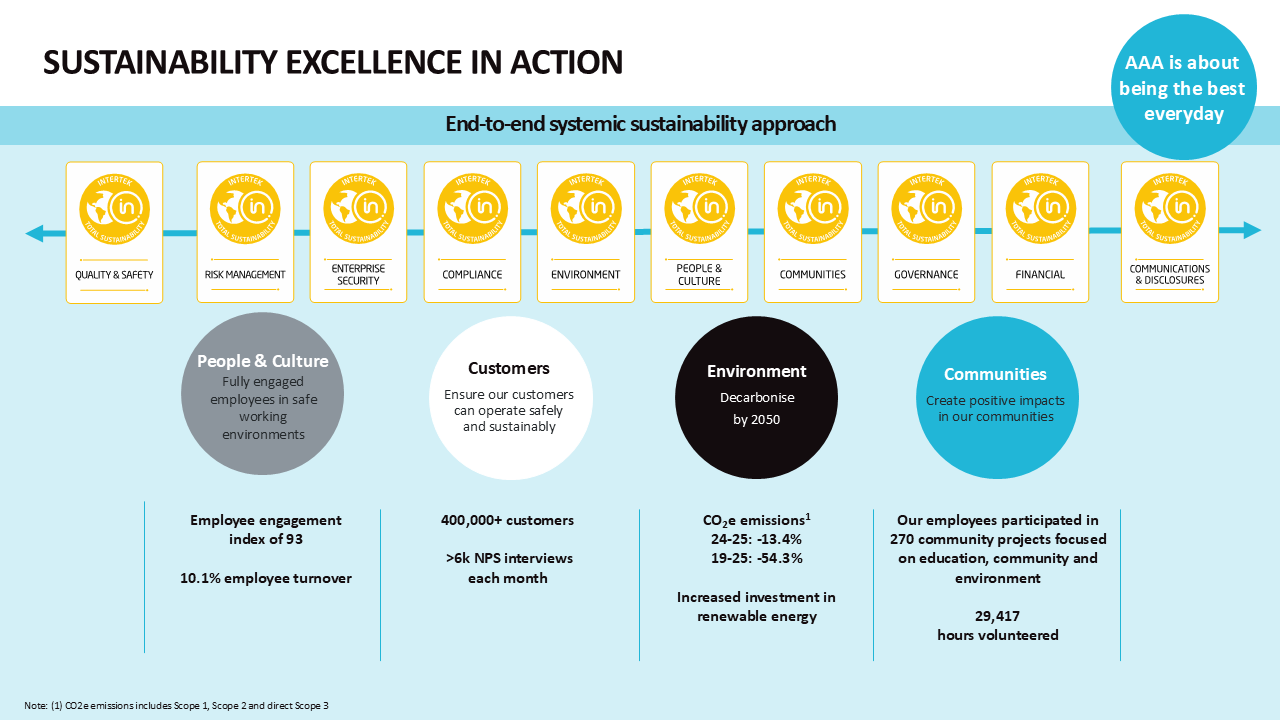
Sustainability is the movement of our time and central to everything we do at Intertek, anchored in our purpose, our vision, our values and our strategy.
Our Sustainability Excellence approach, implemented across every Intertek operation, ensures that we deliver on all aspects of sustainability. It gives us the structure and discipline we need to deliver against our performance targets on areas such as health and safety, customer satisfaction, operational emissions, employee engagement, diversity and inclusion, and compliance.
In addition, our innovative and bespoke sustainability solutions enable our clients to effectively demonstrate their own commitments to sustainability, manage risk and build resilience, and act responsibly.
Lean more about our sustainability solutions.
Positive Impact
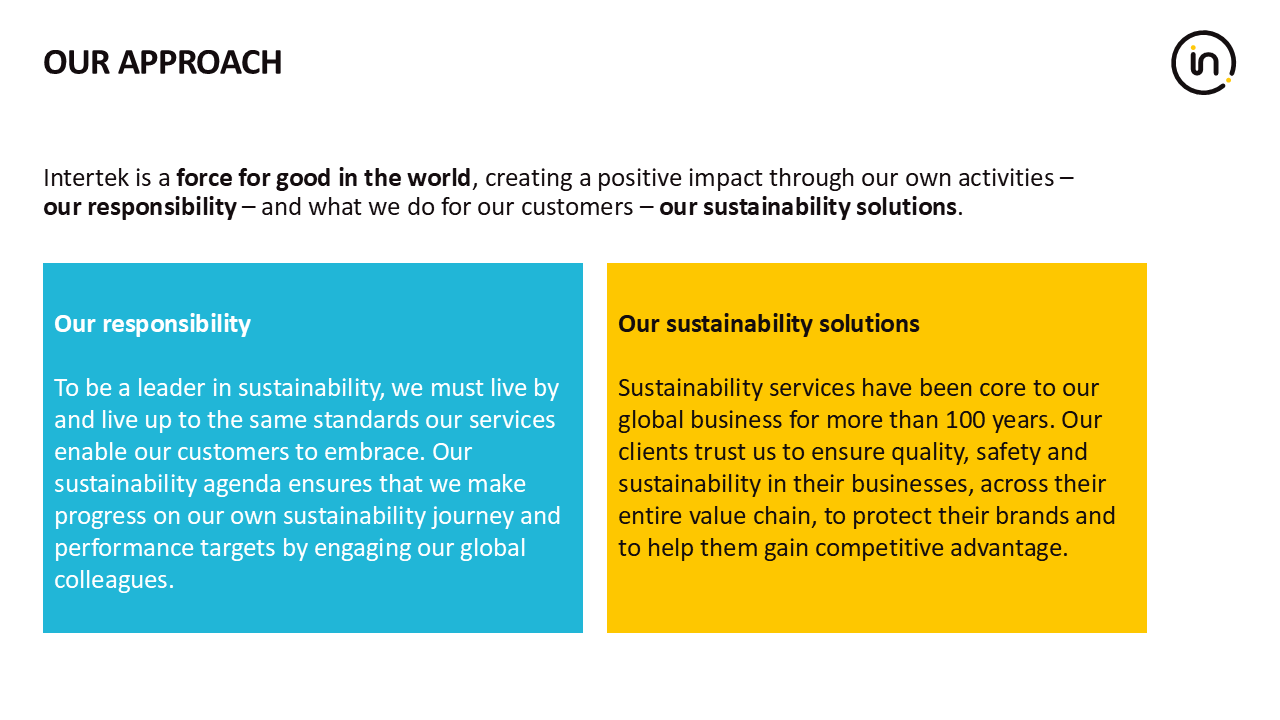
Sustainability services have been core to our global business for more than 100 years.
Our clients trust us to ensure quality, safety and sustainability across their businesses and entire value chains, protecting their brands and helping them gain competitive advantage. We do this across all five of our operating divisions: Consumer Products, Corporate Assurance, Health and Safety, Industry and Infrastructure, and World of Energy.
For example, our Consumer Products division focuses on the ATIC solutions we offer to our clients to enable them to develop and sell better, safer, and more sustainable products to their own clients. We help our clients meet safety, regulatory and brand standards; develop new products, materials and technologies; and import goods within their markets, based on acceptable quality and safety standards.
For more information on how we make a positive impact across our operating divisions and business lines, please see pages 1.34-1.53 of our latest Strategic Report.
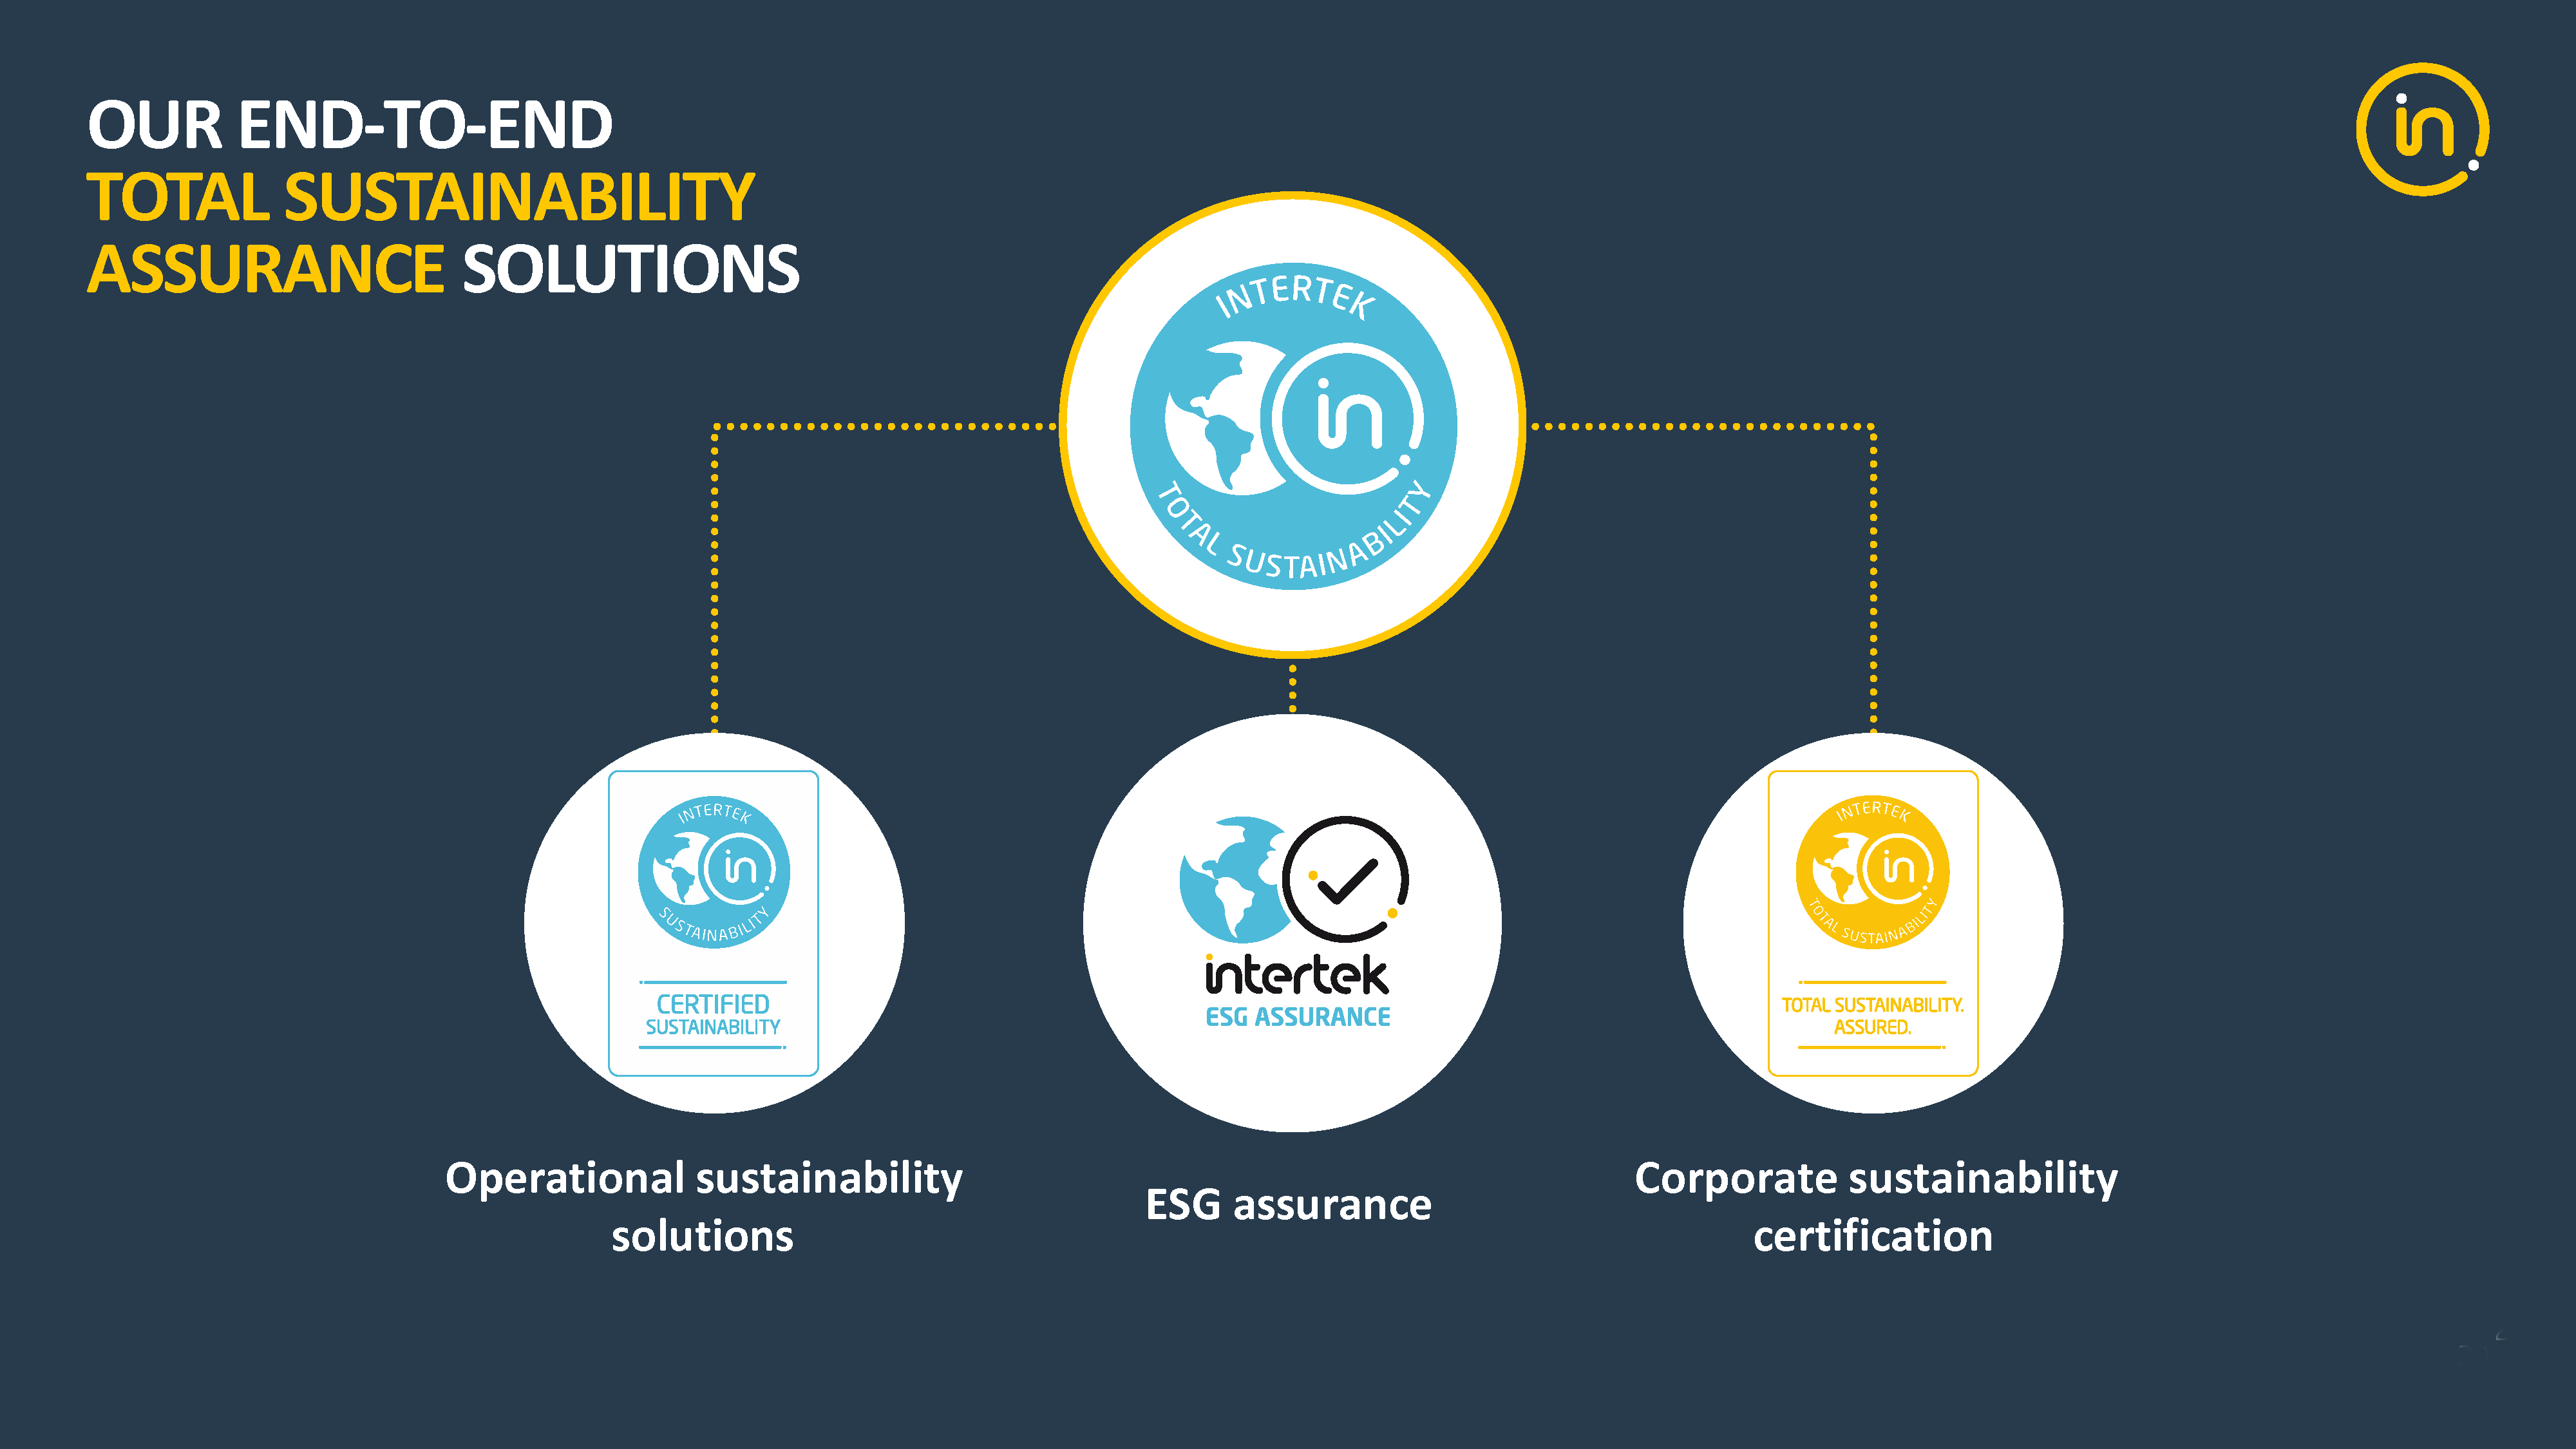
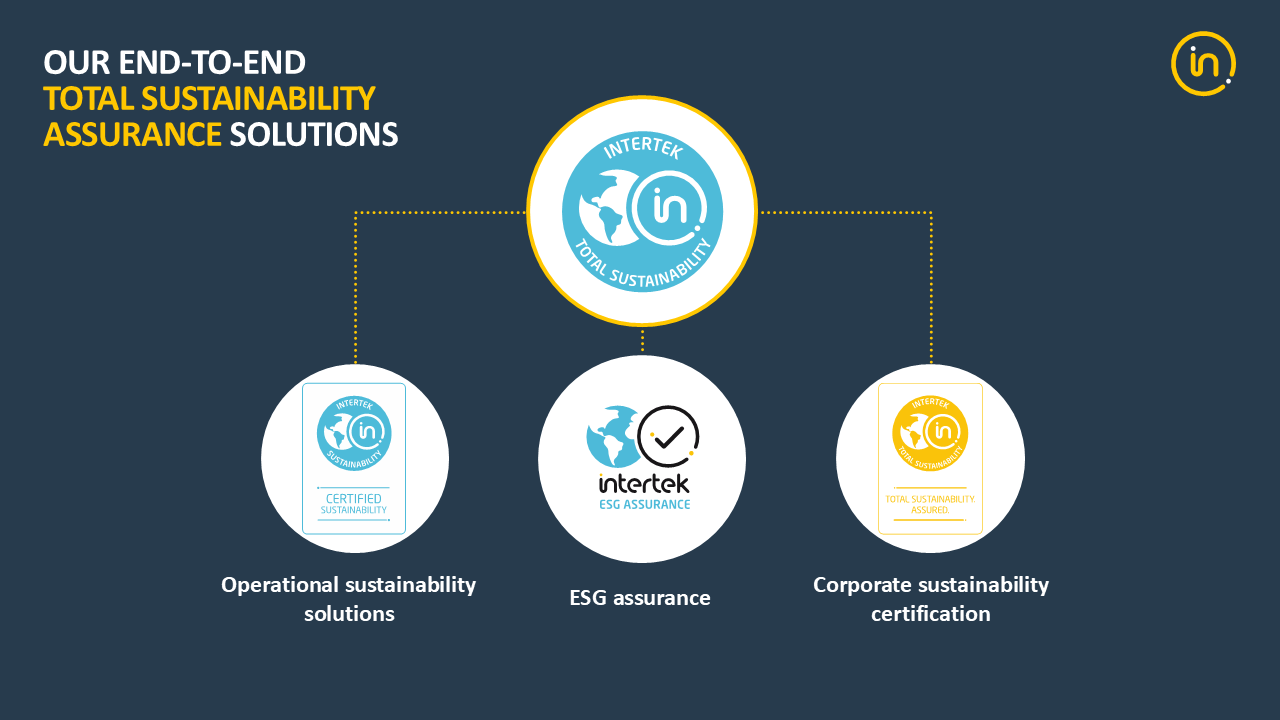
With the greater focus by corporations on sustainability throughout their entire value chain, our sustainability services have become increasingly important for risk mitigation and corporate sustainability certification.
We offer Industry leading operational solutions, focusing on risks within the value chain. These include: R&D development, tier 1/2/3 supplier sustainability performance, energy-waste-water-chemical-air quality-safety management, carbon footprint assessment for scope 1/2/3 and Eco-scoring of their products.
We also advise how companies can complement these with the right sustainability policies underpinned by precise corporate processes which we can audit with our Corporate Sustainability Certification programme.
The reputational risks for companies are significant, and we have seen recently world class companies being fined by regulators for having made unsubstantiated claims about their products. That’s why we help our clients with our ESG assurance solutions which offers an independent audit of their non-financial disclosures.
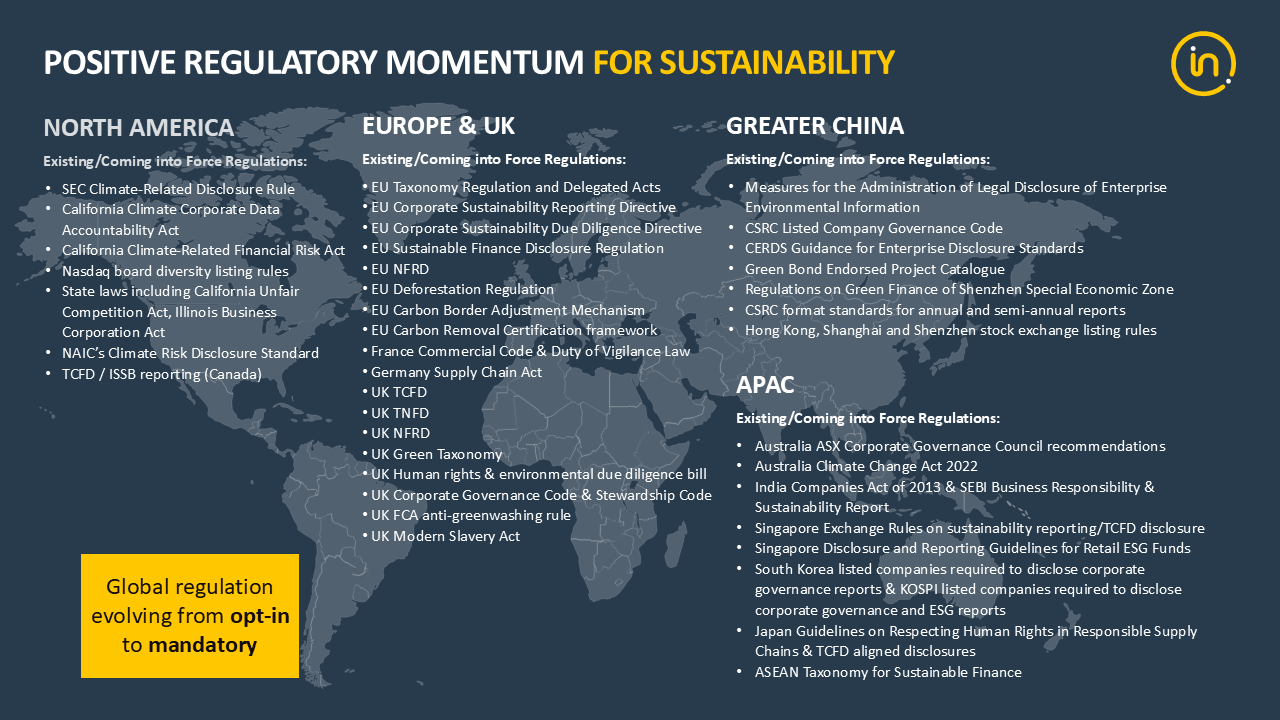
A growth driver for our business is the increased investment by corporations in sustainability as global regulations evolve from opt-in to mandatory.
The increasingly rigorous regulatory environment has highlighted the importance of product safety for consumers, and we are the trusted partner of choice for many global brands to test and certify products.
There has been a greater level of awareness from companies, aided by regulation, on processes within the value chain and the associated risks. Our social audits ensure greater levels of governance across the value chain, ultimately leading to a better and safer world.
An example of this is our audit of Clipper Logistics. Brand reputation is critically important to the company and as such we were asked to conduct an audit of its labour practices. As a result of working with Intertek, Clipper is able to say to its colleagues internally that it is proud of its ethical standards, that people are working for an organisation that is ethically minded, and that the fair treatment of everyone who works for Clipper Logistics is at the forefront of the HR strategy.
To maintain our proactive approach to an increased regulatory environment, we strengthened our double materiality assessment in 2025 by building on the preliminary work undertaken the previous year.
Our Sustainability Journey
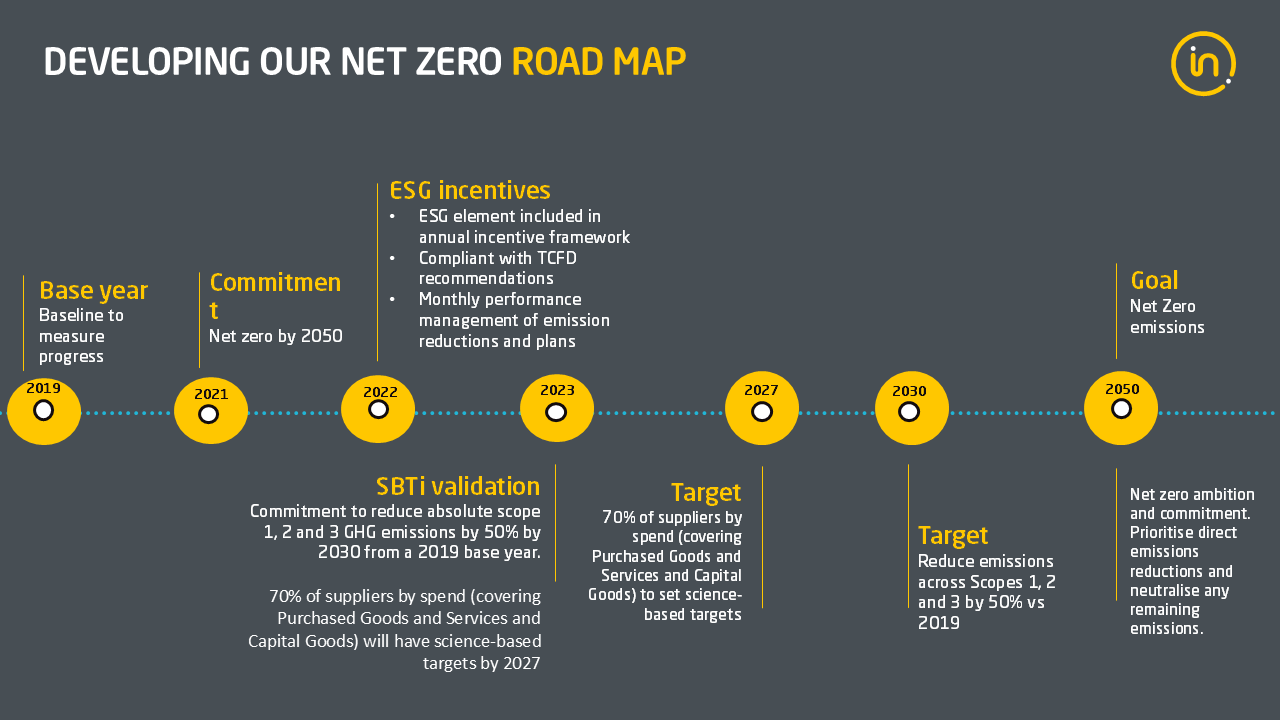
At Intertek we recognise the urgent need to address climate change and are committed to aligning our operations with a low-carbon economy. Our Climate Transition Plan is a critical component of our long-term strategy to reduce greenhouse gas (GHG) emissions, enhance resilience to climate-related risks, and ensure that we contribute positively to global sustainability goals.
We are committed to reaching net zero emissions by 2050, with an interim target to reduce absolute scope 1, scope 2 and scope 3 (business travel and employee commuting) GHG emissions by 50% before 2030. Our interim target is validated by the Science Based Targets initiative (SBTi).
Through energy efficiency initiatives, process optimisation and the increased use of low-carbon technologies, we reduced our market-based emissions and met our scope 1 and 2 target several years early in 2025, delivering a 54.7% reduction against our 2019 base year. We also met our scope 3 target in 2025, achieving a 53.4% reduction against the same 2019 baseline.
Learn more about our efforts to measure and reduce operational emissions.
Improving gender balance is critical for us. We continue to focus on gender diversity by attracting, developing and retaining more talented women across the business. As of 2025, 36% of our Total Quality Assurance Experts are women.
We ensure that men and women are paid equally for doing equivalent roles and we are committed to a number of measures to ensure we provide an energising workplace, free of any gender bias, where employees can flourish based on their talent and effort.
In 2025, we increased the percentage of women in senior management to 27.7%, having set a goal of 30% by 2025. As we work towards a greater gender balance at this level, we will continue to aim for 30%.
Learn more about our efforts to increase the number of women in senior management at Intertek.
In 2025, we marked our ninth consecutive year as a constituent of the FTSE4Good, as well retaining our 'AAA' rating in the MSCI ESG Ratings assessment and our 'Prime' rating under ISS ESG requirements. In addition, we improved our Sustainalytics ESG rating to 15.5 and increased our CDP score from B to A-, demonstrating our progression from ‘well-managed’ performance to recognised climate leadership.
Learn more about our ESG credentials.
Having worked and built relationships to understand the diverse needs of each of our local communities, our countries and business lines define their own agendas to create a positive and lasting impact. These agendas are tied to the Group’s priorities and aligned to the UN Sustainable Development Goals. Our Beyond Net Zero Steering Committee oversees community investments at a global level.
Learn more about our work with local communities and stakeholders in our latest Sustainability Report.
In 2025, our voluntary permanent employee turnover improved to a six-year low rate of 10.1% (2024: 11.2%).
We recognise the importance of employee engagement in driving sustainable performance for all stakeholders, and we measure employee engagement against our Intertek ATIC Engagement Index. In 2025, we achieved a new high score of 93 (2024: 91).
Learn more about our goals and progress against these metrics.
Total Recordable Incident Rate (TRIR) includes medical treatments incidents, lost time incidents and fatalities per 200,000 hours worked. We measure incidents as part of the effectiveness of our safety culture.
Our TRIR target is less than 0.5 per 200,000 hours worked, which we achieved in 2025.
Learn more about our TRIR progress and read about our health, safety and wellbeing approach on pages 2.16-2.18 of our latest Sustainability Report.
We place significant importance on customer satisfaction and feedback at Intertek. We believe that the most effective way of doing this is engaging with our customers through interviews.
Since 2015, we have used the Net Promoter Score (NPS) process to listen to our customers, enabling us to improve our customer service over the years consistently. In 2025, we conducted an average of 6,059 NPS interviews per month.
Learn more about our focus on customer satisfaction.
We conduct compliance training throughout the entire organisation through our global learning management system. In 2025, 99.6% of eligible employees completed our compliance training, highlighting our commitment to the highest standards of integrity and professional ethics.
Learn more about our annual compliance training.